Aperture Photometry Tool (APT), v. 2.8.2
Russ Laher (laher@ipac.caltech.edu)
IPAC, California Institute of Technology, M/S 100-22, Pasadena, CA 91125
Copyright © 2007-2019, All rights reserved.
Always remember the First Rule of Data: Look at the data! Doing this and using this software will make you an “apt” astronomer. 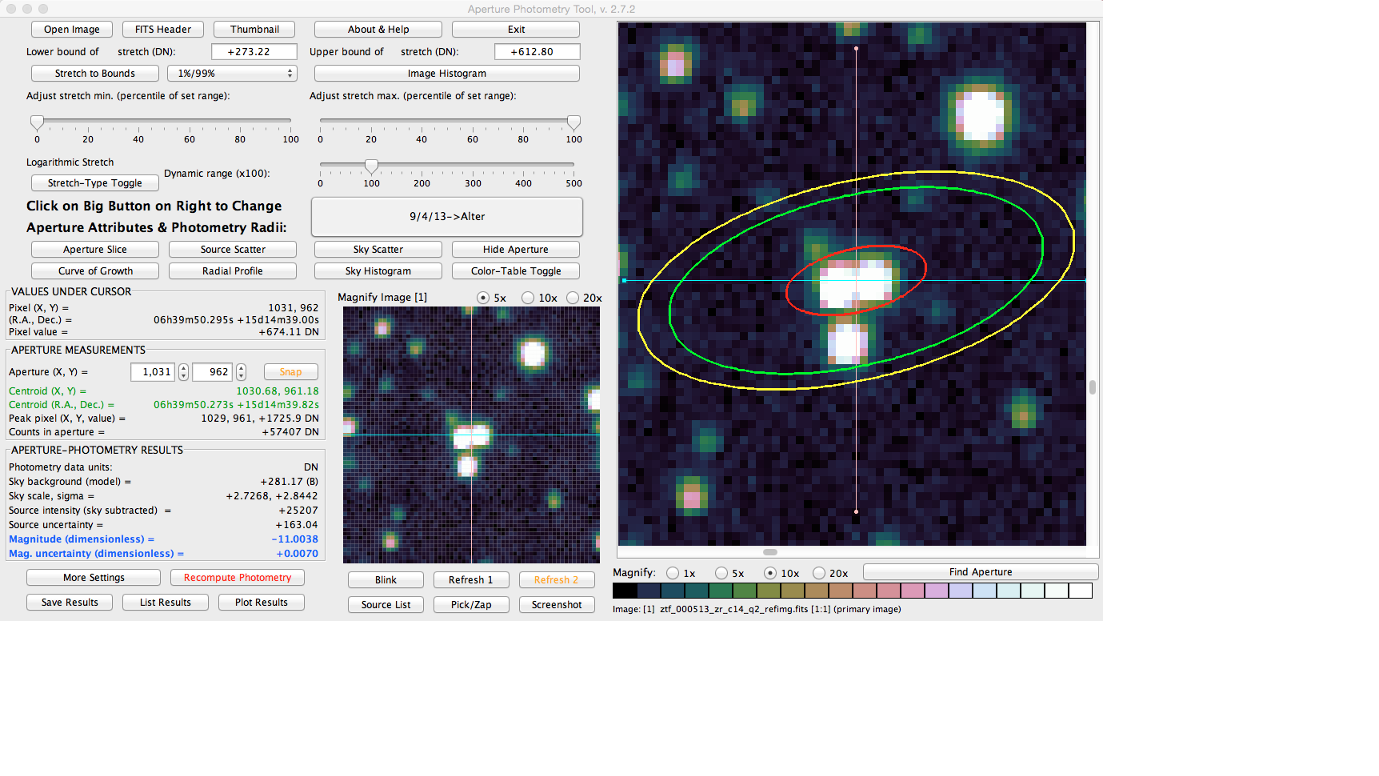
Abstract
APT is software for astronomers interested in manually exploring the photometric qualities of astronomical images. It is a graphical user interface (GUI) designed to allow aperture-photometry calculations to be visualized. The finely tuned layout of the GUI, along with judicious use of color coding and alerting, is intended to give maximal user utility and convenience and minimal chance of blunders. Simply mouse-clicking on a source in the displayed image will instantly compute and print out, for the specified aperture geometry, source intensity and source-intensity uncertainty, along with both conventional and robust measures of the sky background and sky-background scatter. APT is geared toward processing a small number of images, and is not suitable for bulk processing a large number of images (unless a large number of CPU cores are available), unlike other aperture-photometry packages (e.g., SExtractor). However, APT does have a convenient source-list tool that enables aperture-photometry calculations for a large number of detections in a given image, albeit the user is advised that patience is required for the relatively slower computational times expected for software implemented in the Java programming language (although multi-threading can be enabled for faster runtimes). The source-list tool can be run either in the automatic mode to generate a hands-off photometry-results table, or in the manual mode to permit inspection and adjustment of the aperture-photometry calculation for each individual detection. APT displays a variety of useful plots with just the push of a button, including image histogram, aperture slice, source scatter, sky scatter, sky histogram, radial profile, and curve of growth. APT has many functions for customizing aperture-photometry calculations, including outlier rejection, pixel “picking” and “zapping”, and a selection of source and sky models. The radial-profile-interpolation source model, which is accessed via the radial-profile-plot panel, allows extrapolated recovery of flux density in pixels with missing data. Aperture corrections vs. aperture radius can be automatically computed and applied, if activated by the user preferences, so that the aperture size can be reduced for improved signal-to-noise ratio. Many of these software features can be especially beneficial in crowded fields.
Troubleshooting and Bug Reporting

If you experience an unexpected behavior from APT, try looking at the output in the terminal window where you are executing the software (or in the console window if APT was installed and run as a double-click application). This may shed some light on the matter.
If you find a bug, please e-mail Russ Laher (laher@ipac.caltech.edu).
Contents
- Basic Instructions
- Input Images
- Aperture Controls
- Menu Bar
- Preferences
- Aperture-Photometry Settings
- Graphs
- Output Files
- Columns in Output Aperture-Photometry Table
- Thumbnail Panel
- Exporting Images
- Radial-Profile Interpolation
- Pick/Zap Tool
- Source-List Tool
- Aperture-Correction Tool
- Simple Photometric Calibration
- Image Comparator
- Batch Mode
- Software Limitations
- Revision History
- Acknowledgements
- License
- Limitation of Liability
- Disclaimer
Basic Instructions
- Choose the primary image to display. The primary image is the first image displayed in the main image-viewing panel (located in the upper right of the main GUI panel, and is overlaid with the label “CLICK ON IMAGE TO OVERLAY APERTURE”), and provides the input data for the aperture-photometry calculations.
- Adjust the image stretch for best viewing. As an aid, click on the “Image Histogram” button to see the stretch range, and adjust accordingly.
- Select the aperture attributes that are appropriate for the source of interest (integer values only). Similarly, select the centroid, inner-sky. and outer-sky radii. The controls for setting these parameters are located under the Edit menu on the menu bar.
- Place the mouse cursor on image over source of interest and click to overlay an aperture.
- Show/study the various graphs (instructions are given in the Graphs section below).
- Select the desired new radii and/or change other settings as needed.
- Redraw/overlay a new aperture by either clicking on “Recompute Photometry” button OR clicking on “Snap” button for nudging the aperture toward the integer pixel coordinates of the source-centroid location OR placing mouse cursor on the image and clicking.
- If necessary, increment/decrement the aperture position using the spinner controls for fine tuning the aperture’s position.
- Click on the “Recompute Photometry” button to redraw/overlay new aperture.
- Show/study the various graphs again.
- Optionally save/append the calculational results to a photometry-table file (e.g., APT.tbl) by clicking on the “Save Results” button.
- Repeat the above steps for each source of interest!
Input Images
This software reads in only FITS-formatted images. This includes image files with either single or multiple extensions. It also handles FITS files containing data cubes, but not tables (at this time). The software was upgraded in v. 2.6.1 to read in fpack-compressed FITS files directly (which have the .fz filename extension). The software has been tested on FITS images from a variety of projects, including Spitzer, SkyView, IRAS, CFHT, Herschel, LSST ImSim, HST, WISE, and the Palomar Transient Factory (PTF), as well as .fz files from the Las Cumbres Observatory Global Telescope (LCOGT) and Zwicky Transient Facility (ZTF).
Image-data values that are set to NaN (not a number) or Inf (infinity) are displayed with the “blank” color set by the user. Blue is the default blank color, but this can be changed via the available color-picker control. Inf values are handled the same as NaNs and almost no distinction is made between these two special types.
The user can specify the maximum image size that the software will load into memory. This is done via the Preferences menu on the menu bar. The default maximum image size is 10,000 pixels on an image side. For images larger than the assigned maximum, the user will be prompted to specify the desired portion of that image after the filename of the image has been given.
BUNIT is a keyword defined by the FITS Standard for specifying the physical units of the image data. If this keyword is either missing or null in the image FITS header, then the BUNIT setting stored in the user-preferences file will be used. If the stored setting is not available, then, for clarity in various GUI-panel labels, the software will substitute in for BUNIT the setting “D.N.”, which stands for “Data Number”.
Here are some details on the image-display stretch. For purposes of image display only, all pixel intensities outside the interval specified by the stretch extrema are set to the corresponding extreme value; this confines the data set for the histogram plot to within the stretch range. The linear stretch displays intensities that are proportional to the image data values. The logarithmic stretch displays intensities that vary nonlinearly with image data values. Nonlinearity control is provided by a dynamic-range parameter, which must be set to a positive value. Values approaching zero drive the stretch toward linearity, and higher values result in increased nonlinearity that enhances image viewing in the low end of the display range.
The user will quickly learn that the stretch and color-table controls now work only within the visible portion of the image displayed in the upper-right main image-viewing panel. Thus, only this visible portion, plus some hidden margin, is actively updated when image-viewing settings are changed. Moving the scroll bars for large images will reveal the once-active portion of the image inside an obvious bounding box, with possibly a corrupted-looking image display outside of the bounding box. To remove unsightly remnants of the bounding box and refresh the displayed image, two refresh buttons are available. “Refresh 1” just quickly refreshes the visible portion of the image to save time. “Refresh 2” refreshes the entire image, which launches multiple threads for refreshing the unseen portion of the image, so that immediate GUI control is returned to the user. For very large images, however, the threads take some time to complete and may still be running even though the user is allowed to continue normal work with the GUI. To avoid queuing up too many threads, do not click on the “Refresh 2” button repeatedly within the span of a few seconds. The “Refresh 2” button text will turn to the color yellow to remind the user to click on this button before scrolling about the image. It is not mandatory for the user to click on the “Refresh 2” button when its text turns red; the user should do this only if/when the scrolls bars are to be moved.
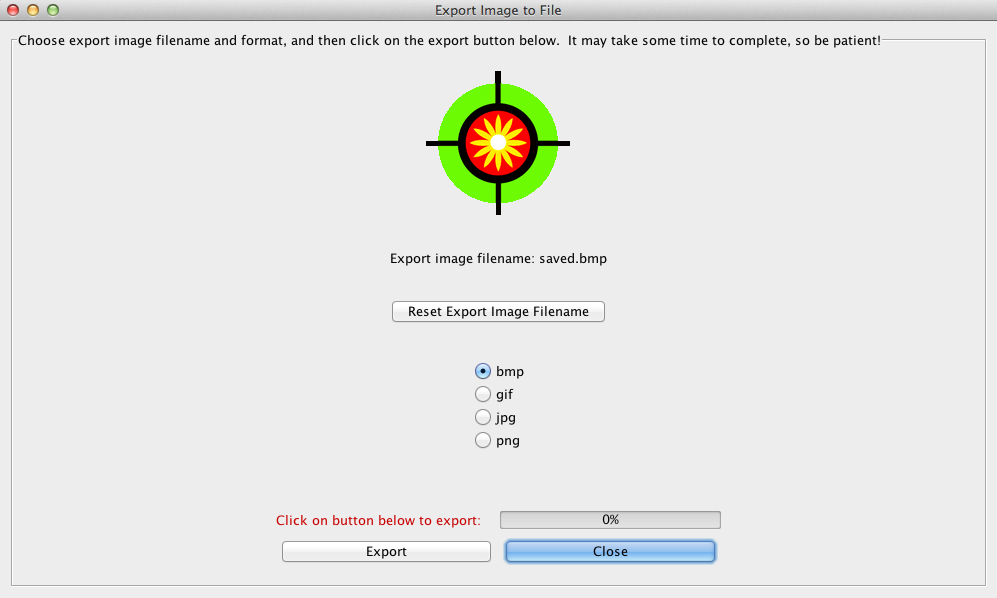
Once the image stretch has been properly set, it is often desirable to save the displayed image in a file for importing into a report document. APT has functionality for exporting a screenshot of the primary image in the following user-selectable file formats: JPEG, PNG, BMP, and GIF. This tool can be accessed via the “Screenshot” button on the main GUI panel, as well as the “Export Image Data to Image File” option under the File menu-bar category.
Aperture Controls
To perform an aperture-photometry calculation, simply mouse-click on the image in the main image-viewing panel at the location where the aperture is to be centered. An aperture graphic will be overlaid onto the image at that location, consisting of the following: a red circle or ellipse representing the aperture, sized according to the aperture major and minor radii settings; horizontal (cyan) and vertical (pink) crosshairs slicing through the aperture center; and circles or ellipses for the inner (green) and outer (yellow) sky annulus, which is displayed only when sky models B, C, D, E, or F which require sky-background subtraction, are selected via the “More Settings” panel (see below for more details). The above image of the main GUI panel shows an example of the aperture graphic.
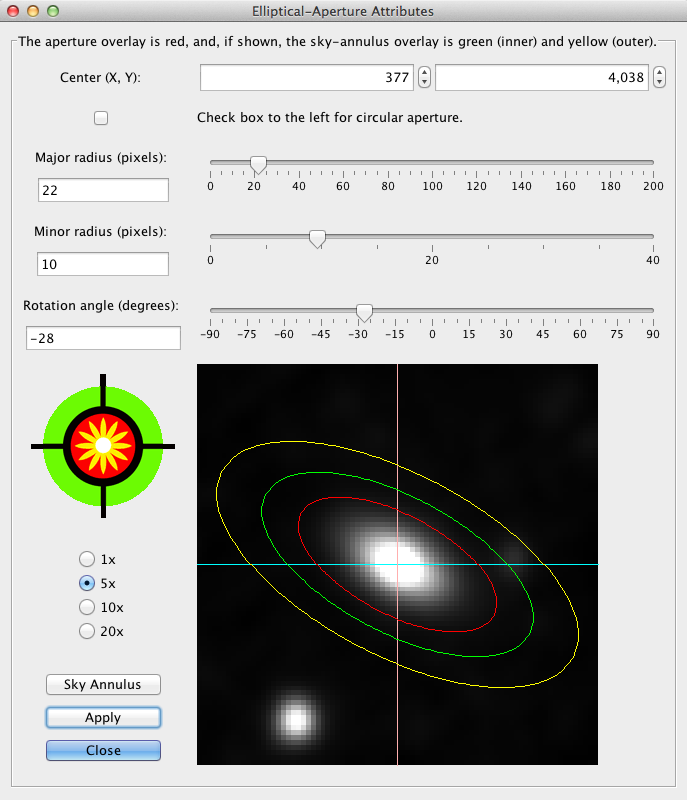
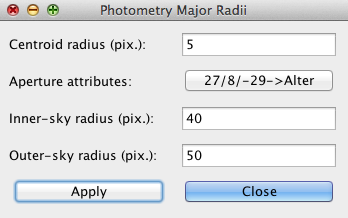
The software permits elliptical apertures with arbitrary orientations. Only integer values can be specified for the major and minor aperture radii and rotation angle. The sky annulus for the background-brightness calculation is sized by scaling the inner and outer sky radii off the aperture’s ellipse axes. The centroid major radius for computing the source centroid can be specified separately from the aperture major radius. The controls for setting these parameters are accessed via the “Major Photometry Radii” and “Aperture Size, Shape, and Angle” options located under the Edit menu on the menu bar. There is also a big button on the main GUI panel for more convenient access.
Changes to the centroid, aperture, and sky-annulus radii, as well as other settings, are only instantiated (to give new results) when either a new aperture is overlaid onto the image, or by clicking on the “Recompute Photometry” button.
Changes to the aperture position via the spinner controls are only instantiated by clicking on the “Recompute Photometry” button.
A “Snap” button is available on the main GUI panel to nudge the aperture onto the computed source-centroid location. After moving the aperture, it recomputes the photometric results (just like the “Recompute Photometry” button). The “Snap” button text will turn yellow to remind the user to click on this button to fully center the aperture on the centroid location. This color reminder can and should be ignored if the user wants photometric results for an aperture that is dislocated from the centroid position. The source-centroid calculation does not always give the best aperture position for the source of interest, especially if there are other sources nearby; use visual feedback from the aperture-slice and source-scatter graphs for improved aperture-positioning.
By default, the photometry calculation is performed with the aperture centered on the calculated centroid and using an aperture-position resolution of 0.2 pixels. The “Centroid (X, Y) =” label on the lower-left main GUI panel is displayed in a green color to indicate this. Un-checking the “Use centroid in photometry calculation?” check box on the “More Settings” panel will cause the photometry calculation to revert to centering the aperture on the integer pixel coordinates of the selected aperture position.
To temporarily remove an aperture overlaid onto the image, click on the “Hide/Show Aperture” button. Click on the same button again to show the aperture.
The pick/zap tool enables users to click on enlarged sub-image pixels in the vicinity of the aperture position to pick off pixel positions and pixel values and put them in a text field in which the data can be copied and pasted elsewhere. The zap function allows selected pixels to be omitted from the calculation for purposes of improving the photometric result. More details are given in the Pick/Zap Tool section below.
Menu Bar
APT has a standard menu bar with the following categories: APT, File, Edit, View, Tools, and Help. This is a work in progress, and new functions are under development for addition as menu options, and existing functions will be added to the menu bar as time permits. Some of the functions accessible via the menu bar can also be accessed via buttons on the main GUI panel (such as opening an image). The APT menu-bar category, a.k.a the application menu has About, Preferences, and Quit options. The File menu-bar category has the following options: Open Image; Set Photometry Filename; Clear Photometry File; Export Image Data to Image File; Export Image Data to CSV (comma-separated values) File; and Export Photometry Data to CSV File. The Edit menu-bar category has the following options: Photometry Major Radii; Aperture Size, Shape, and Angle; Preferences (see next section); and More-Settings Panel. The View menu-bar category currently has two options: Color-Table Levels (to display a panel with the currently existing color-table levels); and Image Comparator. The Tools menu-bar category has the following options: Simple Photometric Calibration; Position Locator; and Decimal/Sexagesimal Converter.

A few of the menu options have keyboard shortcuts. For example, to set the output aperture-photometry-table filename using a File-Chooser Dialog, use “Command-s” for Macs and “Control-s” for Windows machines. For non-Mac machines, some of the menus can be accessed via keyboard mnemonics, such as “Alt-p” for the Preferences menu (no keyboard mnemonics have been included for Macs as this practice is frowned upon in the Mac Developers Guide).
Preferences
Upon APT start-up, a set of customizable user preferences are automatically read in from the default preferences file, called “APT.pref”, located in a hidden directory called “.AperturePhotometryTool” in the user’s home directory. If this file does not exist, then the factory default values are loaded into the user’s APT session (but not automatically saved). Various options in the Preferences menu allow the user to change the default settings and then save them in the default preferences file for later automatic pre-loading (or the user can choose to save it somewhere else and load it in manually later when needed). Selecting the “Reset Default Preferences” option in Preferences menu will restore the factory default settings to the user’s session, but will not save them. If “Save Preferences” is selected, then the current settings of the user’s session will be written to a location and filename of choice, and all prior custom settings in any preexisting file specified will be overwritten.
Note that at any time during a user’s session, most of the current settings, as set by the various GUI controls within and without the Preferences menu, are the instantaneous user’s preferences for the session, albeit not necessarily saved. This can be verified by clicking on the “List Preferences” function under the Preferences menu. Therefore, the “Save Preferences” function under the Preferences menu will capture a large portion of the current state of the user’s session.
Whenever a new primary image is read in, the preferences are restored from file APT.pref in the hidden directory called “.AperturePhotometryTool” in the user’s home directory.
Some of the preferences affect the computing speed of the software. Allow several seconds for computations involving small calculational step sizes and very large centroid, aperture and/or sky-annulus radii. The “Set Maximum Number of Threads” function under the Preferences menu can be changed from its default value of 1 to a larger value, and this will enable multithreading for the source-list tool and, consequently, may drastically improve its computational speed.
Aperture-Photometry Settings
The “More-Settings Panel” option under the Edit menu-bar category allows parameters that are more directly associated with aperture photometry to be changed. This panel can also be accessed via the “More Settings” button in the bottom left corner of the main GUI panel.
Values for outlier-rejection thresholds on the “More Settings” panel must be given in image data units. It is best to show/study the various graphs and set these thresholds before converting image data units to flux-density units, via the “Perform image-data conversion” checkbox on the “More Settings” panel. Note: Saturated pixels are not rejected unless their values fall outside the outlier-rejection limits.
The calculation of source-intensity uncertainty requires both the gain (electrons per D.N.) and the conversion factor from image-data units to D.N. The default value for both quantities is 1.0. The default values can be overridden from the “More Settings” panel. When a primary image is loaded, the software attempts to read the GAIN FITS-keyword and, if found, automatically overrides the default gain value. For image data that are already in units of D.N., the value of 1.0 is appropriate for the image-data-to-D.N. conversion factor.
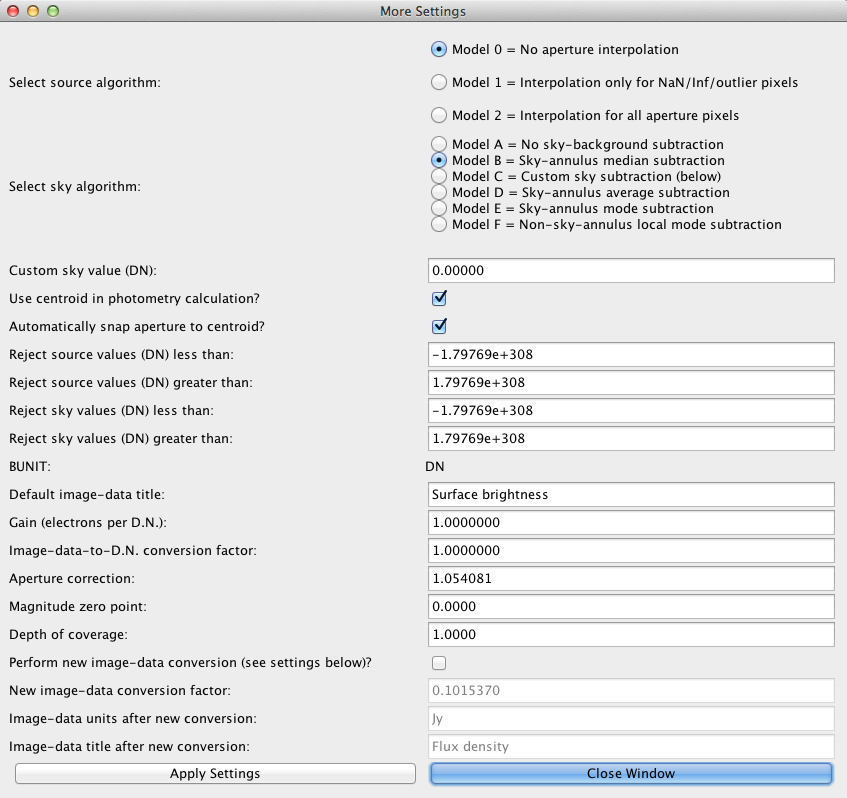
Models B through E are sky algorithms that employ various statistics as sky-background estimators, which are computed over the pixels in a circular or elliptical annulus centered on the source of interest. There is one non-annulus-based sky algorithm called “Model F” that uses a local estimate for the sky background that is computed via bilinear interpolation of the mode statistic computed with a user-specifiable window size on a user-specifiable grid size (the median statistic is used instead if the window is less than 33 pixels). The Model-F input parameters can be changed on the “Local Non-Annulus Sky Background Tool” panel, which can be accessed via the “More Settings” panel and displayed by selecting Model F, clicking on the “Apply Settings”, and clicking the “Yes” button on the pop-up dialog. Model F is potentially more useful than Models B-E in crowded stellar fields.

Near the bottom of the “More-Settings” panel are options to convert the image-data units to other data units for outputting and plotting results. This conversion is ex post facto (“after the action”), and, therefore, the specified magnitude zero point must always be cast in terms of the original data units.
Graphs
APT creates several different kinds of graphs (thanks to the JFreeChart library from www.jfree.org).
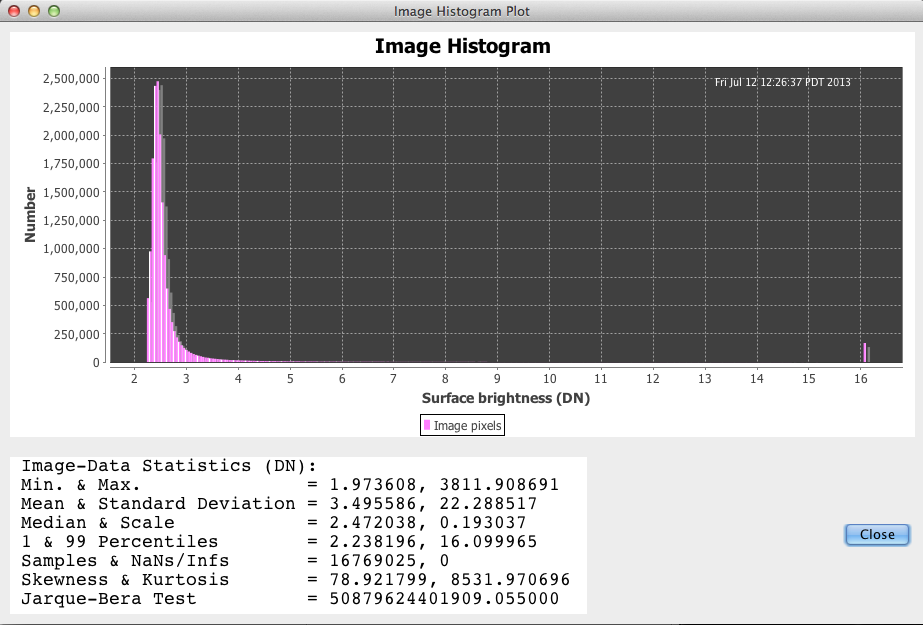
For example, a histogram of the entire image can be plotted by clicking on the “Image Histogram” button on the top-left side of the main GUI panel. The lower and upper limits of this graph’s x-axis are set by the image-display stretch bounds. This histogram is, of course, useful for determining the best stretch. Convenient image statistics are listed on the image-histogram panel, and include mean, standard deviation, median, scale (robust estimator of data-distribution width, given by [84 percentile – 16 percentile]/2), 1 percentile, 99 percentile, number of samples that are not NaNs or Infs (not-a-number or infinity), and number of NaNs and Infs. Except for the number counts, the data units of the image statistics are given by the image’s BUNIT FITS-header keyword, or, if BUNIT is not available, set to “D.N.” (which stands for “Data Number”).
Display the graphs by clicking on main-GUI-panel buttons labeled “Image Histogram”, “Aperture Slice”, “Source Scatter”, “Sky Scatter”, “Sky Histogram”, “Curve of Growth”, and “Radial Profile”, in any order, although the order listed is a good one for adjusting the APT settings systematically. Here is an example of a curve-of-growth plot:

Each time a graph button is clicked on, a new graph is displayed, and previously displayed graphs are not destroyed. This software behavior allows users to create and compare graphs from different APT settings. Users must exercise some discipline in closing graph windows themselves, in order to prevent proliferation of graphs on their computer screens.
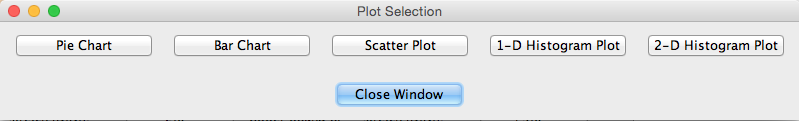
APT has capabilities for plotting aperture-photometry results in publication-ready appearance, which is accessed via the “Plot Results” button located in the lower-left corner of the main GUI panel. Pie charts, bar charts, scatter plots, histogram plots, and density (2-D histogram) plots are available. Generally, the pie and bar charts are useful when only a few data points are available for graphical comparision, and, conversely, the histogram and density plots are useful when there is a large number of data points.
Other things to know about the graphs:
- The graphing software cannot handle very large or very small numbers, and responds by creating a graph with no numbers on the affected graph axis. If this is encountered, adjust the outlier-rejection range as needed until the problem goes away (click on “More Settings” button on bottom-left side of main GUI panel).
- Drag mouse cursor across graph to narrow the range of the plotted data.
- Right-click mouse on graph to zoom in/out, save as PNG image, etc. (Mac users will need a “mighty mouse” and, will also have to configure the mouse under “System Preferences” to set up right-click as a secondary button).
Output Files
During the operation of this software, several output files are created. Except for the following exceptions, all output files are created in the scratch directory with fixed filenames. The photometry-table path/filename, location of the scratch directory, and user-preferences path/filename can be changed via the Preferences menu. Only the user-preferences file called “APT.pref” in a hidden directory called “.AperturePhotometryTool” in the user’s home directory, if the file exists, is automatically read in upon APT start-up; however, additional user-preferences files can be created with different names and locations, but these must be loaded manually.
| Fixed or Default Filename |
Definition |
| APT.pref |
Customizable user preferences that are read in upon APT start-up |
| APT.tbl |
Table of photometric results, in plain-text format with space-delimited columns. |
| fitsHdr.txt |
FITS header |
| apertureSliceX.dat |
Horizontal image slice across aperture |
| apertureSliceY.dat |
Vertical image slice across aperture |
| skyScatter.dat |
Image data in sky annulus |
| sourceScatter.dat |
Image data in source aperture and sky annulus |
| curveOfGrowth.dat |
Data shown in curve-of-growth graph |
| radialProfile.dat |
Data shown in radial-profile graph |
| radialProfileDataFitCurve.dat |
Data-fit curve shown in radial-profile graph |
| radialProfileDataFitModel.dat |
Data-fit model for radial-profile graph |
| scatter.dat |
Photometry-table results in scatter plot (selected columns by user) |
| sourceListByAPT.dat |
Source list extracted from image |
Columns in Output Aperture-Photometry Table
APT generates a table of photometric results in a plain-text, space-delimited file, the default filename of which was given in the previous section. The columns that make up this table are listed below. Note: A new column called Flags was added in APT, v. 2.7.8.
| Column(s) |
Definition |
| Number |
A source counter, which is reset to one each time either 1) a new primary image is loaded; or 2) the source-list tool is executed. In the case of the latter, the ordering of this counter is consistent with the input source list (and the ordering of the output will be generally different if multithreading is enabled). |
| ApertureRA, ApertureDec |
Sky coordinates of aperture center (decimal degrees or sexagesimal representation, as set by preferences menu). |
| CentroidRA, CentroidDec |
Sky coordinates of source centroid (decimal degrees or sexagesimal representation, as set by preferences menu). |
| ApertureX, ApertureY |
Image coordinates of aperture center (nearest-integer pixel coordinates). |
| CentroidX, CentroidY |
Image coordinates of source centroid (fractional-pixel coordinates). |
| CentroidFlag |
“Centroiding” flag, equal to 1 when the option to perform the photometry calculation with the aperture centered on the calculated centroid has been selected, and zero otherwise. This option is accessible on the control panel via the “More Settings” button on the bottom-left of the main GUI panel. |
| SourceIntensity |
Integrated intensity of the source (in the aperture), in data units given by the “DataUnits” column (see below). Can either include the sky contribution or not, depending upon the setting of the “SkyModel” column. |
| ApertureCorr |
Applied aperture correction, a factor greater than one, to account for the fraction of source intensity outside of the aperture, which is useful when avoiding large aperture to improve the signal-to-noise ratio. |
| SourceUncertainty |
Uncertainty associated with the source intensity, in data units given by the “DataUnits” column (see below). This calculation uses “SkyScale” as a robust estimator of the sky-background sigma (see below). |
| DataUnits |
Data units of “SourceIntensity”, “SourceUncertainty”, “SkyMedian”, “SkyAverage”, “SkyRMS”, “SkyCustom”, “SkySigma” and “SkyScale” columns. |
| Magnitude |
Magnitude representation of “SourceIntensity”. |
| MagUncertainty |
Magnitude uncertainty, given by 1.0857 times “SourceUncertainty” divided by “SourceIntensity”. |
| SourceModel |
“0” if no radial-profile interpolation has been done;
“1” if radial-profile interpolation has been done only for NaN/Inf pixels in the aperture; or
“2” if radial-profile interpolation has been done for all aperture pixels. |
| SkyModel |
“A” if the background-sky contribution has not been subtracted from the “SourceIntensity” (see above);
“B” if the sky median has been subtracted;
“C” if the custom sky has been subtracted;
“D” if the sky average has been subtracted;
“E” if the sky mode has been subtracted; or
“F” if the non-annulus-based local sky background has been subtracted (see “SkyLocalNonAnnulusBkg” below). |
| SkyMedian |
The per-pixel median of samples in the sky annulus after the sky outliers have been rejected, in data units given by the “DataUnits” column above. This value, which is a robust estimator of the sky level, times the number of pixels in the aperture form a product that is the sky contribution optionally subtracted from the integrated image data of the source. |
| SkyMode |
The per-pixel mode of samples in the sky annulus after the sky outliers have been rejected, in data units given by the “DataUnits” column above. This value, the most frequent one in the sky histogram, times the number of pixels in the aperture form a product that is the sky contribution optionally subtracted from the integrated image data of the source. |
| SkyAverage |
The per-pixel average of samples in the sky annulus after the sky outliers have been rejected, in data units given by the “DataUnits” column above. The disparity between the average and the median is an indicator of non-uniformity in the distribution of samples. |
| SkyLocalNonAnnulusBkg |
A non-annulus-based, local sky background estimate, in data units given by the “DataUnits” column above, which is computed via bilinear interpolation of the mode statistic in a user-specifiable square window size on a user-specifiable grid size (the median statistic is used instead if the window is less than 33 pixels). |
| SkyRMS |
The per-pixel root-mean-squared (RMS) value of samples in the sky annulus after the sky outliers have been rejected, in data units given by the “DataUnits” column above. This value is slightly larger than the average, and will be equal to the population standard deviation in the special case of zero-mean samples. |
| SkyCustom |
The per-pixel custom-sky value specified by the user, in data units given by the “DataUnits” column above. |
| SkySigma |
The standard deviation of samples in the sky annulus after the sky outliers have been rejected, in data units given by the “DataUnits” column above, calculated using the “unbiased” or “n-1” method. This result has not been inflated to account for the optional data-clipping of the distribution’s tails (needs to be rectified in a future version of this software). |
| SkyScale |
Robust estimator of the sky-background sigma, in data units given by the “DataUnits” column above. It is given by the difference between the 84 and 16 percentiles of the sky-data distribution (which correspond to +/- one standard deviation in a Gaussian distribution), divided by 2. |
| RadiusCentroid |
Major radius of the ellipse for the source-centroid calculation (pixels). |
| ApertureMajorRadius |
Major radius of the elliptical aperture for the source (pixels). |
| ApertureMinorRadius |
Minor radius of the elliptical aperture for the source (pixels). |
| ApertureRotationAngle |
Rotation angle of the elliptical aperture for the source (degrees). This angle is with respect to the image’s horizontal axis, and a positive angle rotates the ellipse counter-clockwise. |
| SkyRadiusInner, SkyRadiusOuter |
Major radii of the elliptical inner and outer sky annulus (pixels). The corresponding minor radii are derivable by assuming that the sky-annulus inner and outer ellipses are proportional to the aperture ellipse. |
| ApertureNumPixels |
Number of samples in the aperture after the source outliers have been rejected (see “ApertureNumRejected” column below). It is these samples that are summed to yield the integrated image data in the aperture. This quantity has a fractional component because the photometry calculation is now being done with sub-pixel resolution. |
| ApertureNumRejected |
Number of source outliers rejected. These represent losses of integrated image data, for which no accounting has been made in the current version of APT software. |
| SkyNumPixels |
Number of samples in the sky annulus after the sky outliers have been rejected. |
| RadialProfileFWHM |
Full width at half maximum (FWHM) of the radial profile of the source. |
| Flags |
An integer that contains bit-wise binary flags for various conditions that affect the aperture-photometry calculation.
| Bit |
Value |
Condition |
| 0 |
1 (=2^0) |
Aperture contains one or more source pixels (or portions thereof) with non-NaN values that were rejected from the photometry calculation (i.e., outside of range defined by lowerSrcDataLimit and upperSrcDataLimit in APT.pref). |
| 1 |
2 (=2^1) |
Aperture contains one or more source pixels (or portions thereof) with blanks or NaNs (not a number). |
| 2 |
4 (=2^2) |
Aperture contains one or more source pixels (or portions thereof) with values at or above the saturation level (caveat emptor: pixels in the original image might have been zapped, in which case, these are not included here). |
As an example, if an aperture contains all three types of abnormal pixels (rejected, blank, and saturated), then the flags value will be 1+2+4=7.
Note: If either of the interpolation source algorithms is selected (Model 1 or 2), then the flags for bits 0-2 will apply to the interpolated values that replace original values.
|
| Image |
Path/filename of image. |
The photometry-table file can be listed by clicking on the “List Results” button, and a maximum of 100,000 records per file will be listed. User-selected columns in the photometry table can be plotted one against another by clicking on the “Plot Results” button. Both buttons are located in the bottom-left corner of the main GUI panel. The latter button displays the following panel, which has controls for setting up scatter and histogram plots.
Thumbnail Panel
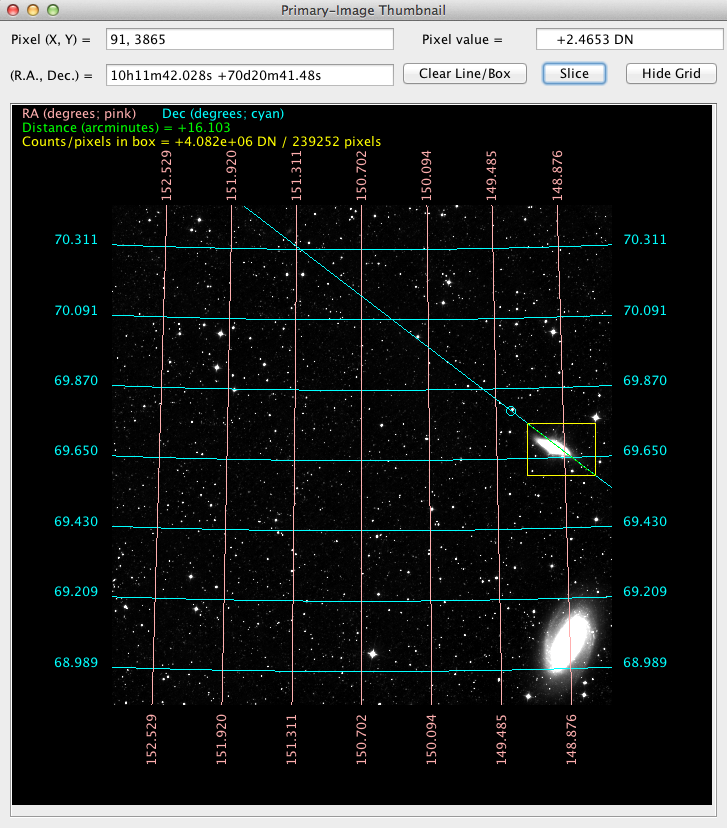
The “Thumbnail” button on the bottom middle of the main GUI panel pops up a separate panel that is capable of displaying the entire primary image, rather than just the image portion displayed in the main image-viewing panel. At the top of the thumbnail panel are “Clear Line/Box”, “Slice”, and “Show Grid” buttons, and a display of the real-time mouse-cursor position in both image and equatorial coordinates, as well as a display of the real-time pixel data value at the cursor position.
The mouse cursor can be dragged across the thumbnail image to overlay a green line between two points of interest in the image, as well as a yellow box. The angular separation between the two points is computed, in angular units if the world coordinate system (WCS) is available, otherwise in pixels. The integrated intensity of the image data and the number of pixels contained in the rectangular box are computed. The box has been dubbed “Laher’s square”! The “Clear Line/Box” button can be utilized to remove the green-line and yellow-box overlay.
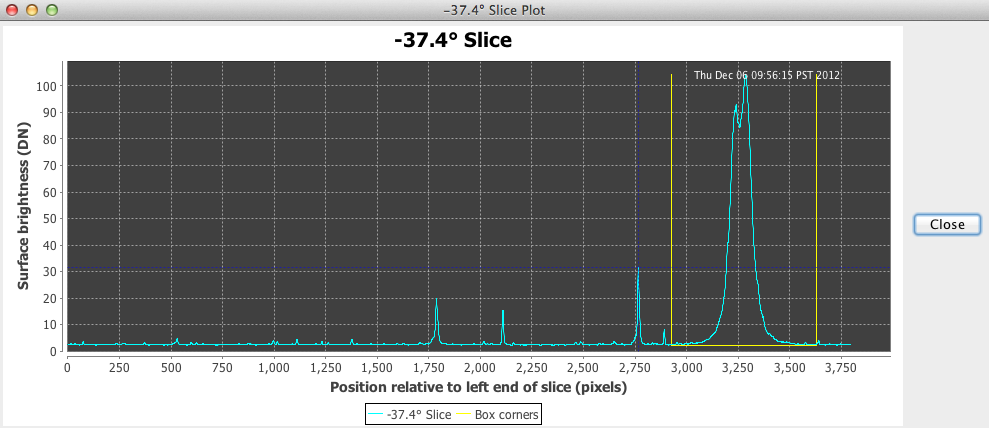
Once a Laher’s square has been overlaid onto the image, the “Slice” button will be enabled. The “Slice” button pops up a plot of the image data across the entire image along a line through the mouse-pressed and mouse-released corners of the box. The slice can be horizontal, vertical, or at an arbitrary angle, depending upon the direction the mouse is dragged. When a user clicks on a curve feature in the slice plot, a small circle will be drawn around the corresponding source in the thumbnail image.
The “Show Grid” button will overlay a grid labeled with equatorial coordinates, and then subsequently transform into a “Hide Grid” button. If a WCS is not available in the image’s FITS header, then the coordinates-grid overlay will be disabled.
The thumbnail image can be made to fit on the user’s computer screen using the “Set Maximum Thumbnail Size” option in the Preferences menu. If the thumbnail image is set to larger than the user’s screen, then the panel will be automatically scaled to fit and scroll bars will appear. The maximum size of the thumbnail image has been limited to no less than 500 pixels.
Exporting Images
The software can export a screenshot of the primary image to a file (after the user has adjusted the image stretch for best viewing), and allows a choice of the following popular image formats: JPEG, PNG, BMP, or GIF. This functionality can be accessed by the “Screenshot” button on the main GUI panel and the “Export Image Data to Image File” option under the File menu-bar category.
Radial-Profile Interpolation
Note: the radial-profile generation and its subsequent use in interpolation should only be done for circular apertures.
The radial-profile graph panel has extra controls for fitting the data associated with the currently selected source to a parameterized model radial profile. There is also a function that computes full-width at half-maximum (FWHM) of the radial profile, in pixels.
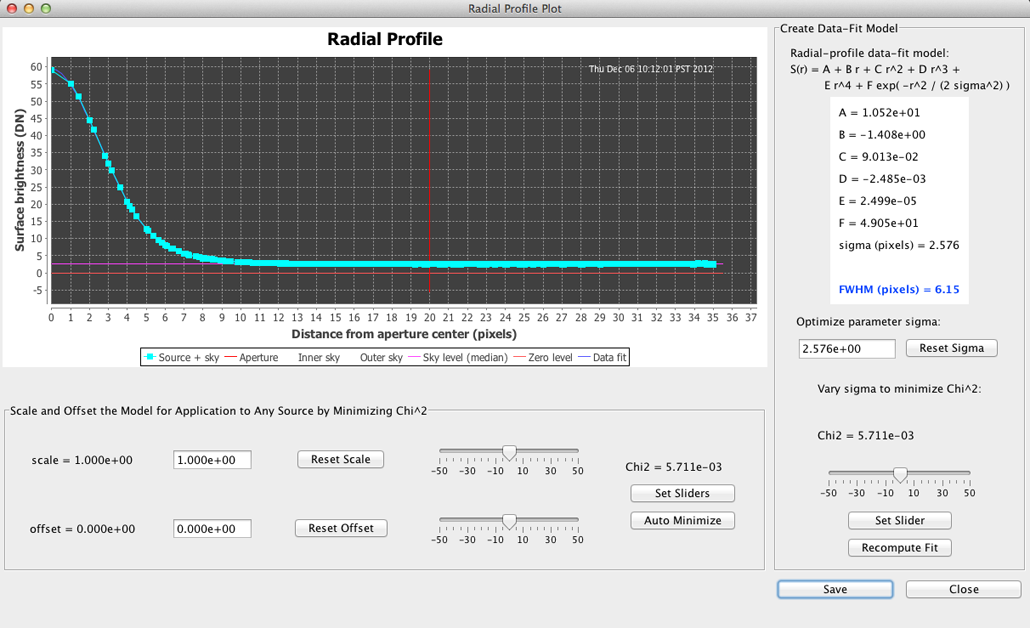
The radial-profile model is
S(r) = A + B r + C r^2 + D r^3 + E r^4 + F exp( -r^2 / (2 sigma^2) )
where: S(r) is the surface brightness as a function of radial distance from the aperture center, r, in pixels; constants A through F are determined via linear regression; and sigma is a fixed parameter that can be manually adjusted to optimize the data fit. In order to build a model for the image of interest, the user must follow these instructions precisely:
- On the “More Settings” panel (accessed via the “More Settings” button on the lower left part of the main GUI panel), select the “Model 0” source algorithm and the “Model A” sky algorithm. Also, the checkbox labeled “Perform new image-data conversion” on the “More Settings” panel should NOT be checked. A screenshot of the “More Settings” panel is given above. Warnings will be given when the model is saved with these conditions not met.
- Fit the radial-profile data by operating the controls on the right-hand side of the radial-profile-plot panel (accessed via the “Radial Profile” button on the main GUI panel). A new fit will be done when the user clicks on either the “Reset Sigma” button, the “Set Slider” button, or the “Recompute Fit” button. Typically, the “best fit” is obtained when Chi^2 is minimized; this, at least, is the goal of the linear regression as implemented in APT. Hint: A not-so-good fit can be made better by reducing the aperture and sky-annulus radii. When a new fit is done, the scale and offset parameters are reset to 1.0 and 0.0, respectively (more details about these model-exogenous parameters are given below).
- Once the user has obtained an acceptable fit, the model parameters can be saved by clicking on the “Save” button. The model parameters are written to a file in the scratch directory called “radialProfileDataFitModel.dat”. Only the data-fit model that has been written to this file will be subsequently used in APT calculations involving interpolation.
Once the radial-profile model parameters are saved (as described above), the model can subsequently be used for interpolation with any of the appropriate source algorithms available and any of the available sky algorithms. The algorithms can be selected on the aforementioned “More Settings” panel. The source algorithms that involved interpolation are described as follows.
The “Model 1” source algorithm is used for interpolating across aperture pixels with NaNs/Infs, outliers, or saturated data, in order to fill in missing flux density. It also replaces the missing flux density associated with rejected source outliers in the aperture, provided that the interpolated result falls within the lower and upper limits set for source outlier rejection.
The “Model 2” source algorithm is used for interpolating flux densities in all aperture pixels, even for those pixels with good data. When this source algorithm is selected, a two-parameter linear regression is automatically performed for each aperture-photometry calculation to scale and offset the radial-profile model (treated as a fixed model here), in order to best fit the model to the data for the sources of interest. Thus, the radial-profile model can be derived from one source and applied to other sources. This model is particularly useful when the image data have an axially symmetrical point spread function (PSF) and the PSF is invariant over the image; in this case, the “Source List Tool” described in a separate section below can perform what is essentially PSF-fitting photometry for a large number of sources. The computed aperture-photometry result from this source algorithm will be less sensitive to the effects of noise in the image data.
Finally, the radial-profile graph panel has also been equipped with controls for manually scaling and offseting the radial-profile model. The current purpose of these controls is mainly to allow the user to experiment with the scale and offset parameters and instantly visualize the effects on the plotted model curve. In a later APT version, it is possible that functionality may be added to allow manual override of the currently built-in automatic scaling and offsetting of the radial-profile model when used for interpolation.
Pick/Zap Tool
The pick/zap tool, which is access via the eponymous button located on the lower middle of the main GUI panel, has a few useful functions for probing and fine-tuning aperture-photometry calculations. After an aperture has been overlaid onto a primary-image source in the upper right of the main GUI panel, an enlarged sub-image centered on the aperture is displayed in the pick/zap tool’s work area. Moving the mouse cursor over the sub-image causes the passed-over pixel positions and associated image-data values to be rapidly displayed.
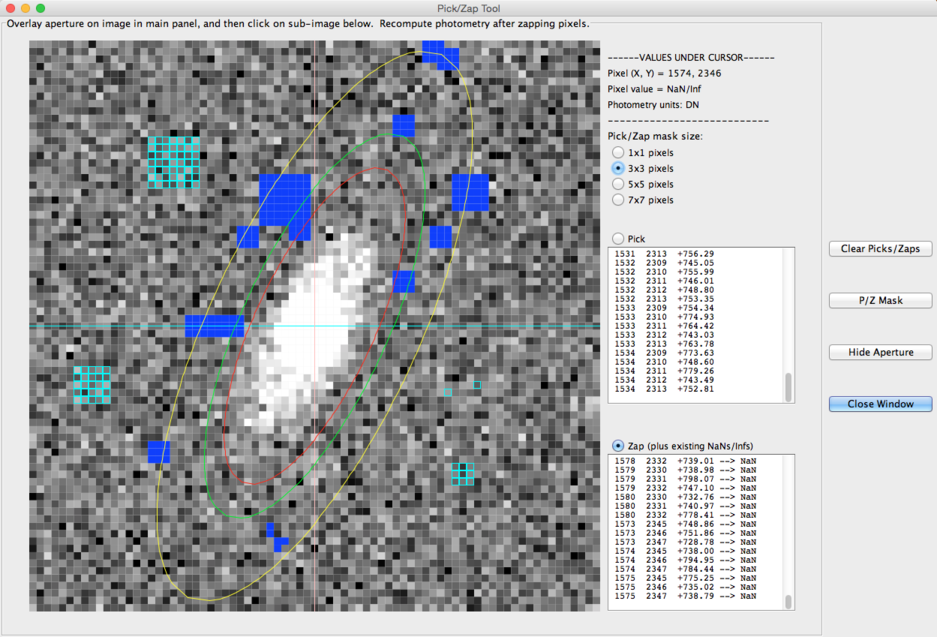
When the “Pick” radio button is selected (and an aperture-centered sub-image is displayed), the user can mouse-click on the sub-image to pick out specific pixels. Picked pixels are highlighted in the sub-image by an outline around the pixel in the current pick color. The picked image-pixel coordinates and associated image-data values are listed in the adjacent text area. The image-data values can be copied to the clipboard from the text area for analysis by other software programs. The pick color can be changed via the preferences menu.
When the “Zap” radio button is selected, the user can temporarily set specific pixel values to NaN (not a number) by mouse-clicking on the pixels of interest. NaN values are excluded from the aperture-photometry calculations, but this happens only after the “Recompute Photometry” button has been clicked on to update the aperture-photometry calculation. Zapping a pixel causes the “Recompute Photometry”-button text to change from the color black to the color red as a reminder to the user that the photometry calculation needs to be updated. Pixel-zapping functionality is useful, for example, for eliminating sources from the sky annulus that adversely affect the sky-background calculation. Zapped pixels are displayed in the sub-image with the blank color, and their locations and associated image-data values are listed in the adjacent text area. The blank color can be changed via the preferences menu.
The “Hide/Show Aperture” button is a toggle that hides or shows the overlaid aperture. It is included as a convenience for more clearly showing the sub-image. When the aperture is not hidden, all aperture pixels are on/inside the aperture, which is drawn in the color red on the sub-image. The sky-annulus pixels are on/between the sky annulus, which is drawn in the colors green (inside) and yellow (outside).
The picks and temporary zaps are kept on the sub-image and in the text areas when the “Hide/Show Aperture” button is pressed. This is also true when any of the image-display controls are adjusted, including stretch, linear/logarithmic scaling, color table, and pick and blank colors.
The centroid, aperture, and sky-anulus radii can also be changed without clearing the picks and zaps. The same goes for changes made within the “More Settings” panel. After these sorts of changes, in which the aperture may be resized, but is not moved, either the “Recompute Photometry”-button text will change from the color black to the color red to indicate that the photometry calculation needs to be updated, or the photometry will be recalculated in the case of radii changes. Clicking on the “Recompute Photometry” button will nevertheless use the new radii in the updated aperture-photometry calculation.
Finally, any adjustment that changes the aperture’s position will cause the picks and temporary zaps to be cleared, and the image-data values will revert to those in the original image. Note that NaNs in the original image will, of course, be preserved. The aperture can be moved by clicking on either another source in the upper-right main image-viewing window, or the “Snap” button, which will automatically move the aperture to the centroid position. Adjusting the aperture-position spinner controls will also clear the picks and zaps, although the aperture movement itself, in this case, will not be done until the “Recompute Photometry” button has been clicked on. Clicking on the frame around the main image-viewing window when the mouse cursor is shown in the cross-hair style will cause the overlaid aperture and displayed sub-image to be removed, as well as the picks and zaps.
Source-List Tool
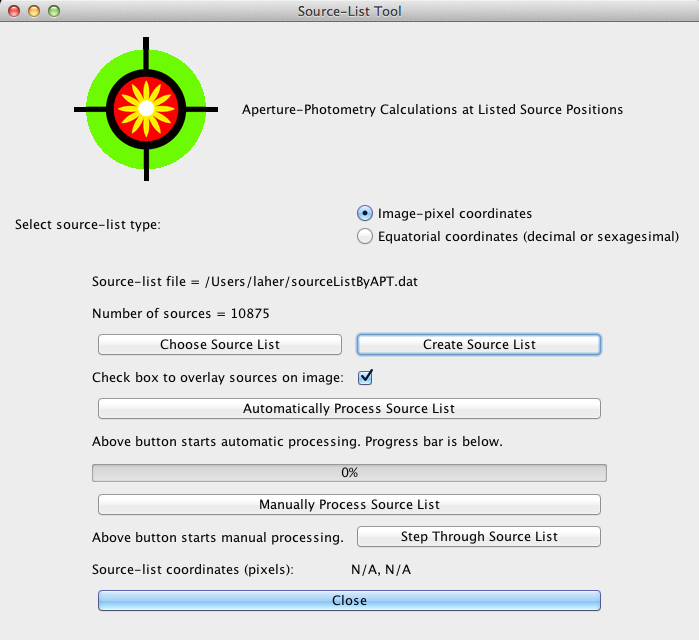
After an image for aperture-photometry calculations has been selected, the user can access the source-list tool via the “Source List” button on the upper-left side of the main GUI panel. The tool does automatic or manual processing of a source list associated with the chosen image. Source lists for this tool can be created by parsing the output of popular source-extraction software, such as SExtractor. It is even possible to create a source list by editting APT’s output photometry-table file (after copying it to another filename).
The source-list tool first requires that the filename of a source list be selected. The format of the source-list file is plain text and consists of one set of source coordinates per line in the file, where the coordinates are delimited by one or more spaces. Either image-pixel coordinates or equatorial coordinates are permitted. Equatorial coordinates can be either in decimal degrees or the sexagesimal representation with “hms dms” delimeters (e.g., 233.73800 or 15h34m57.12s with no spaces for right ascension, and -23.50319 or -23d30m11.5s with no spaces for declination). An optional header line at the beginning of the source-list file is allowed and auto-detected. Here is an example source-list file:
x       y
723.2   279.0
729.4   145.45
622.195 205.857
595.9   318.4
731.11  195.54
674.84  140.09
643.2   153.1
735.0   161.6
742     237.83
718     301
664     316
715     236
The maximum number of sources allowed is 100,000.
An exception will be raised if the file format is incorrect (e.g., comma-separated values are not allowed).
The user has the option of selecting the button labeled “Automatically Process Source List”, in which case, aperture-photometry calculations will be performed for all sources in the source list for the current aperture-photometry settings. Thus it is important that the user select the desired aperture-photometry settings before pressing this button. Once this option has been selected, identical aperture-photometry calculations will be done for all sources in the source list, and a record will be automatically saved for each source in the photometry-table file. The marker “Automatic Source-List Processing…” will be written to the photometry-table file prior to saving the aperture-photometry records.
The computing can be speeded up by taking advantage the source-list tool’s multithreading capability. Under the Preferences menu, the option “Set Maximum Number of Threads” can be selected to increase the number of parallel-computing threads from one, the default value, to some larger value usually of the order of the number of available processor cores. Multiple threads, which are scheduled by the operating system, complete in no particular order, and this can result in records in the output photometry-table file that are out of order with respect to the input source list. However, the “Number” column in the photometry-table file allows the user to easily match records to input sources.
Another option available to the user is the “Manually Process Source List” button, in which case, an aperture will be overlaid onto the image for the first source in the source list, and the message “Ready to process source number = 1”, along with the image-pixel coordinates of that source, will be displayed. The user can, at this time, study the image in the vicinity of the aperture and manually adjust any or all of the aperture-photometry settings for that particular source on the main GUI panel and via the “More Settings” button, and then press the “Recompute Photometry” button and view the graphs to make sure that the settings are just right. After the user is satisfied with the settings for that particular source, the “Step Through Source List” button can be pressed, which will redo the aperture-photometry calculation, save a record of the calculational results in the photometry-table file, and then overlay an aperture onto the image for the next source in the source list. The marker “Manual Source-List Processing…” will be written to the photometry-table file prior to saving the aperture-photometry record for the first source. The above steps are repeated for each successive source in the source list. After the source list has be exhausted, the message “Done with source list.” will be displayed. To reset manual processing and start again (perhaps after another selection of aperture-photometry settings has been made), simply press the “Manually Process Source List” button once more.
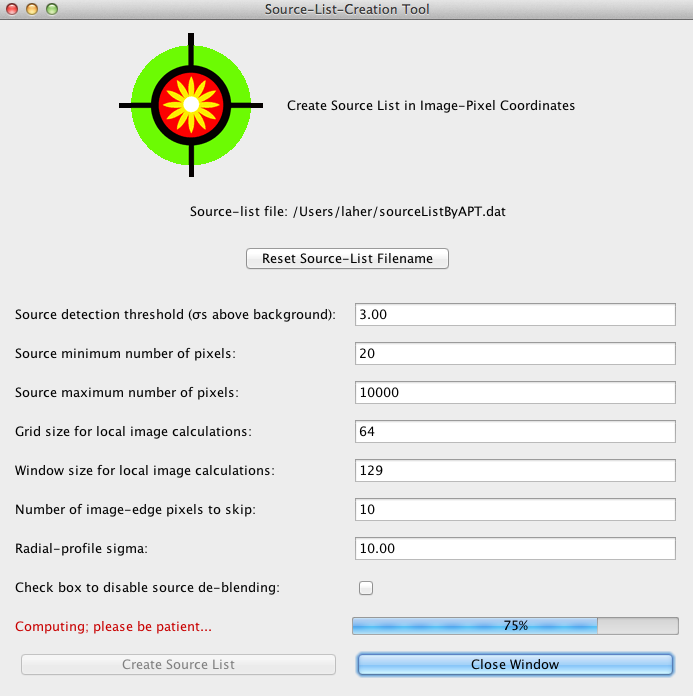
A function for extracting sources from the image data and creating a source list is available. It utilizes spatially-varying thresholding that is comprised of a local background (normally the mode statistic, or the median if window size is less than 33 pixels) and local data dispersion (“sigma” is given by one half the difference between the 84.1 and 15.9 percentiles), and allows the user to select the grid and window sizes for these local-image statistics. The source detection threshold is an input parameter for the number of “sigmas” above the local sky background to threshold the image data. A source or set of unresolved sources is defined by a contiguous blob of above-threshold image pixels. Input parameters that limit the minimum and maximum number of pixels allowed for a source and that avoid detections near an image edge are available. Sources are deblended using a peak-detection algorithm, which looks for peaks in a source blob that have surrounding pixels with mostly lower data values within a 5×5-pixel region centered on the peak, in accordance with the selected radial-profile sigma, an input parameter on the “Source-List-Creation Tool” panel. The source list is generated with image-pixel coordinates.
Aperture-Correction Tool
As the size of an aperture is increased, the signal from the source becomes more fully contained and the noise encompassed by the aperture is increased, and, therefore, the signal-to-noise ratio (SNR) of the aperture photometry result is decreased. According to Mighell (ASP Conf. Ser., Vol. 172, pp. 317-328, 1999), the optimum SNR for a Gaussian PSF is obtained for a circular aperture radius of ~1.6 times sigma or approximately equal to 0.68 times the full width at half maximum (FWHM). Thus, the optimal aperture will not fully contain the source flux. There are also cases where source-crowding effects warrant using a smaller aperture. In such cases, a multiplier greater than one, called an aperture correction, is needed to correct for source intensity outside of the aperture. In theory, an aperture correction is always needed because of limited bandwidth considerations, but, in practice, no aperture correction is made for sufficiently large apertures. These considerations mainly influence the size of the aperture chosen for a study.
APT’s Radial-Profile Tool can be used to determine the FWHM of a representative source. APT’s Aperture-Correction Tool can be used to determine the aperture-correction value needed as a function of circular-aperture radius. The method involves computing curves of growth for bright, non-saturated, isolated stars in the image of interest. The curves of growth are normalized and averaged. The resulting curve is inverted to give the aperture correction vs. aperture radius. The appropriate aperture-correction value for a given aperture radius is then entered into the text field labeled “Aperture correction:” on the “More Settings” panel. This can be done either manually or automatically. Under the “Preferences menu”, the “Aperture-Correction Mode” can be set to either: 1) Manually set aperture correction; 2) Automatically compute aperture correction with input dialog; or 3) Automatically compute aperture correction using inputs from saved preferences or default values. The last option causes the Aperture-Correction Tool to be executed automatically each time a new image is loaded, which will increase the loading time somewhat.

Simple Photometric Calibration
As of version 2.0.0, this software includes a user-friendly tool to provide the capability of performing simple photometric calibration. The tool matches two source lists and computes a single parameter, the photometric zero point, via sum-of-squared-error minimization. At least one match is required, but no more than 100,000 matches are allowed in the computation. The algorithm makes two passes through the data. The first pass computes robust data statistics, namely, the median and the data dispersion given by one half the difference between the 84.1 and 15.9 percentiles (which is equivalent to 1 standard deviation in the case of Gaussian-distributed data). The second pass applies outlier rejection and faint-source rejection to filter the data. A sufficient variety of data statistics are included in the output to guide the user in setting up repeat calculations to refine the result.
The required inputs are two space-delimited source lists in plain-text files. The software presumes one of the source lists is calibrated and the other is not. The calibrated source list must have only the 3 following columns: right ascension, declination, and absolute magnitude. The uncalibrated source list must have only the 3 following columns: right ascension, declination, and instrumental magnitude. The source lists can contain pairs of sky coordinates in either decimal degrees or sexagesimal representation. Each source-list file may include a header line containing 3 space-separated, single-word column titles (e.g., “RA Dec Mag”). The software will read in up to 100,000 sources from each source list. The source lists are, by default, expected to be located in the source-list directory specified in the APT user preferences, but the user can navigate elsewhere, if necessary.
There are optional inputs to control the computation. The match radius gives the maximum tolerable distance between sources for a match, and its default value is 1 arcsecond. The outlier-rejection threshold, in magnitude, allows outliers to be defined and excluded from the computation, and its default value is 0.3. The faint-source-rejection threshold, in magnitude, assures that only matches of sufficient brightness will be included in the computation, and its default value is 21. The tool will optionally normalize the zero point by an input exposure time, and the default exposure time is 1 second (which is equivalent to not normalizing by the exposure time).
The tool generates and displays a plot of magnitude difference vs. magnitude. There are options to customize the plot on the tool’s main panel. The user can also right mouse click on the plot to expose additional plotting options. One of these options allows the user to save the plot as a PNG image.
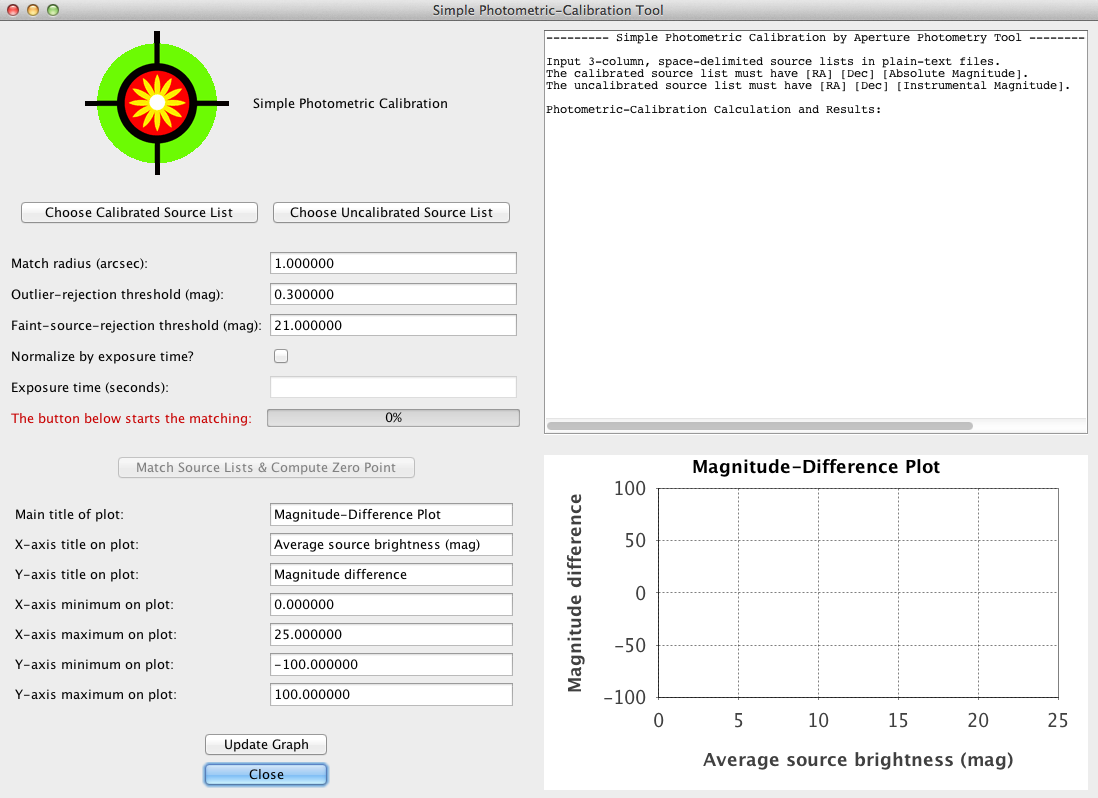
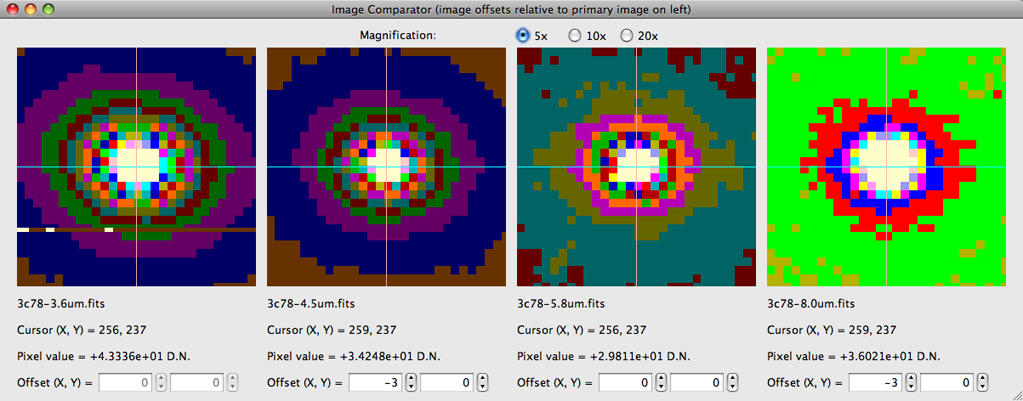
Image Comparator
This software comes with a pop-up tool called the “Image Comparator” with up to four magnifier panels that allow simultaneous comparison of a “primary image” with up to three different “comparator images”. Each comparator image can be offset in X and Y using the available spinner adjustments. Separate control over the stretch of each comparator image is currently not implemented, although this is planned for a future release. In the meantime, for comparing images with requiring drastically different stretches, judicious use of the primary-image log-stretch capability can compensate somewhat for this tool’s deficiency. This tool can be accessed via the “Image Comparator” option under the View option on the menu bar.
Batch Mode
APT can be executed from the command line in a non-interactive or batch mode. In this mode, the GUI will not be displayed. The following command-line options are available:
APT.csh -i input_FITS-image_filename
        -p user_preferences_filename (default is ~/.AperturePhotometryTool/APT.pref)
        -s input_source_list_filename or "sourceListByAPT" for automatic source-list creation
        -o output_aperture-photometry-table_filename (default is ~/.AperturePhotometryTool/APT.tbl)
	-b output local_non-annulus_sky_background filename (default is ~/.AperturePhotometryTool/skyBackgroundModelF.fits)
        -z zero_point (defaut value is -999999.99)
        -h (help switch for available command-line options)
To activate batch mode on the command line, the -i and -s options must be invoked together to specify the input FITS image and the source-list file, respectively. Control of the software in the batch mode is done primarily via the saved user preferences in any file specified by the -p option or the default location and filename for automatic loading (which is APT.pref in the .AperturePhotometryTool hidden directory in the user’s home directory). Batch-mode users can also optionally invoke the -o option for the output aperture-photometry-results filename and/or the -z option for the photometric zero point (defaut value is -999999.99). The local non-annulus sky background is always computed, but applied only when Model F (user-preferences noSkyFlag=5) is specified.
In a terminal window, here is an example of how to do it on a Mac or Unix machine:
APT.csh -i myImage1.fits -s mySourceList1.txt
APT.csh -i myImage2.fits -s mySourceList2.txt
APT.csh -i myImage3.fits -s mySourceList3.txt
...
For Windows machines, replace “APT.csh” with “APT.bat” above in a command-prompt window.
Mac users, in addition to the *.dmg file, may want to also install the APT *.tar.gz or *.zip file, which will create a folder where APT.csh is more easily accessible (than in the /Applications folder).
APT’s source-list tool should first be executed in the normal (non-batch) mode in order to set up the source-list option: pixel coordinates or (R.A., Dec.) in decimal degrees. You will also need to consider changing input parameters and options on the “More Settings” panel and elsewhere (e.g., aperture radius). Preferences should be saved after making the desired selections. Saving preferences in the default APT.pref file preserves the settings for subsequent the batch-mode calculations. Preferences, such as specifying the maximum number of allowed threads for the multi-threaded calculations, can make a huge difference with respect to computing time. Test runs in non-batch mode will give you an idea of how long the processing will take (for extremely long source lists and large images, you may want to process them overnight).
Software Limitations
The default maximum image size is 10,000×10,000 pixels, which has been tested on a computer equipped with 2 GB of RAM. The maximum-image-size setting under the Preferences menu can be increased to accommodate larger images (assuming the user’s machine has sufficient memory) and, in conjunction with this increase, the user may have to start up APT with a larger heap-space setting (currently java -mx20484M APT is executed in APT.csh, the APT C-shell start-up script for UNIX-based platforms). For Mac users running APT as a double-click application, you can similarly edit the -Xmx2048M specification in “/Applications/Aperture\ Photometry\ Tool.app/Contents/Info.plist”.
These items will be addressed in later software versions (your votes count):
- No “north is up” button.
- No navigation box on thumbnail image.
- No capability of handling accompanying data masks and coverage images.
- Calculation of source-intensity uncertainty does not include pixel-to-pixel noise correlations.
- Limited accuracy for crowded fields and extended objects, although the highest accuracy possible for aperture photometry can be obtained by using APT’s new aperture-correction tool in conjunction with the option to estimate the sky background using the non-sky-annulus-based mode statistic (Model F).
Finally, some of the Spitzer SPOT/Leopard Java classes for conversion from pixel to celestial coordinates have been incorporated into APT. The following projections are supported for conversion of equatorial coordinates to pixel coordinates and vice versa (APT does not do galactic coordinates, at least not yet anyway):
- Gnomonic or tangent
- Orthographic
- Cartesian
- Aitoff (for FITS-viewing only)
APT handles geometric image distortion only for the gnomonic projection at this time. Two distortion conventions are supported. The SIP convention is applied for images with CTYPE1 = ‘RA—TAN-SIP’ and CTYPE2 = ‘DEC–TAN-SIP’. In the absence of SIP keywords, APT will attempt to read in and apply any PV distortion keywords in the FITS header for images with either CTYPE1 = ‘RA—TAN’ and CTYPE2 = ‘DEC–TAN’ or with CTYPE1 = ‘RA—TPV’ and CTYPE2 = ‘DEC–TPV’. PVi_j distortion keywords are generated by SCAMP and also consumed by SExtractor and SWarp. APT computes SIP distortion up to ninth polynomial order and PVi_j distortion up to seventh polynomial order.
Revision History
v. 2.8.2 (4/29/19)
Upgraded the Simple Photometric Calibration Tool to allow either decimal or sexagesimal coordinates in the input lists.
Added a -v command-line option to allow users to control the verbosity of the standard output (adding the associated code logic in all the needed places is a work in progress):
APT.csh or APT.bat, v. 2.8.2

Interactive-Mode: Refrain from using both -i and -s options below together.

Batch-Mode: Use both -i and -s options below together; other available options can also be used.

Command-Line Options Available:
 -i input FITS-image filename
 -p user_preferences filename
 -s input_source_list_filename or "sourceListByAPT" for automatic source-list creation
 -o output aperture-photometry-table filename
 -b output local_non-annulus_sky_background filename; always computed, but applied only when Model F (noSkyFlag=5) is specified
 -z calibrated image magnitude zero point
 -v verbosity level; default is zero; 0 or 1 is currently recognized
Thanks to Paul Leyland for these suggestions.
v. 2.8.1 (4/9/19)
Fixed a sign-error bug when converting sexagesimal values that lie in the (-1, 0) range into decimal values. Thanks to Paul Leyland for reporting this problem.
v. 2.8.0 (3/8/19)
Added logic to function processHeaderCard in the ReadFitsFile class, in order to fix a bug that prevents loading an image from the multi-extension HST-WFPC file w0ji2201t_c0f.fits. Thanks to Richard Nowell (Bristol U.K.) for reporting this issue.
v. 2.7.9 (2/21/19)
Added logic to better detect HDUs containing image data in FITS files. Thanks to Paul Leyland for reporting this issue.
v. 2.7.8 (1/25/19)
Bug fix: Forgot to divide output attribute ApertureNumRejected by the square of the calculational step size. Recast ApertureNumRejected from integer to double, in order to track fractional pixels.
Interface-change warning: There is a new column included in the output photometry-table file, called Flags, which is an integer that contains bit-wise binary flags for various conditions that affect the results.
 Aperture-Photometry-Tool Flags

 Bit   Value   Condition
 --------------------------------------------------------
  0       1     Aperture contains one or more source pixels (or portions thereof) with non-NaN values that were rejected from the
                photometry calculation (i.e., outside of range defined by lowerSrcDataLimit and upperSrcDataLimit in APT.pref).
  1       2     Aperture contains one or more source pixels (or portions thereof) with blanks or NaNs (not a number).
  2       4     Aperture contains one or more source pixels (or portions thereof) with values at or above the saturation level
                (caveat emptor: pixels in the original image might have been zapped, in which case, these are not included here).

Note: If either of the interpolation source algorithms is selected (Model 1 or 2), then the flags for bits 0-2 will apply to the
      interpolated values that replace original values.
Thanks to Paul Leyland for suggestions that led to this improvement.
v. 2.7.7 (12/12/18)
Modified the WCS class to apply the PC matrix in fixing a CDELT1 sign error, which is needed for Pan-STARRS images. Thanks to Richard Nowell (Bristol U.K.) for pointing out this problem.
v. 2.7.6 (11/30/18)
Modified APT to check whether the to-be-loaded FITS image is compressed (regardless of filename extension). The allows the software to load Pan-STARRS images, which are compressed, but do not have the .fz filename extension. Thanks to Rick Nowell for raising this issue.
v. 2.7.5 (11/9/18)
Fixed bug in PrimaryImageFilter.java that prevented *.fts images from being loaded.
v. 2.7.4 (11/9/18)
Forgot to increase -Xmx1024m to -Xmx2048m in the Info.plist file used for the double-click Mac application, which is normally installed in the /Applications folder (see related upgrade in the revision history for the previous version of APT below).
Increased the default maximum image size from 5Kx5K pixels to 10Kx10K pixels. It takes a minute or so to load an image this large, so be patient!
Modified the code that loads a FITS image to allow FIT and FTS (all letter-case permeatations) as FITS-filename extensions, in addition to FITS and FZ. Thanks to Jim DeYoung for this refinement.
v. 2.7.3 (10/15/18)
Modified the ReadFitsFile class to more generally handle the parsing of multi-extension FITS files that include admixtures of IMAGE and TABLE header-data units (HDUs). Modified the HDU class to add XTENSION and ZTENSION as attributes. Added error checking for the case where a FITS file has no image HDUs.
Increased the default Java heap-space size allocated for APT start up from 1024 to 2048 megabytes, so that APT can load images as large as 10Kx10K pixels.
Completely overhauled the Pick/Zap Tool, in order to dramatically improved its responsiveness. Changed the default pick color from blue to cyan to differentiate it from the default blank color.
Sorted out a bug that prevented the photometry-file table header from being written when individual photometry records are saved. Thanks to Roc Cutri for apprising me of this problem.
v. 2.7.2 (5/24/18)
Added “Peak pixel (X, Y, value)” to the display of quantities in the “APERTURE MEASUREMENTS” box on the main GUI panel. Thanks to Jim DeYoung for this suggestion.
Modified the ReadFitsFile class to more generally handle the parsing of multi-extension FITS files.
v. 2.7.1 (1/23/18)
Improvement to function that exports photometry data to a CSV file: Write a hash character (#) at beginning of lines for preferences and header keyword/value pairs, in order to signal file parsers ignore them as comment lines.
Speeded up the function that exports photometry data to a CSV file, and also substantially reduced its memory requirements.
Added capability of setting up APT preferences to automatically generate a CSV photometry file with time tags from a FITS-header keyword, such as OBSMJD, when executing source-list processing in the batch mode. Thanks to Dr. Giuseppe Leto of the INAF – Osservatorio Astrofisico di Catania for this suggestion.
v. 2.7.0 (1/18/18)
Changed the default blank and saturated pixel colors for the cubehelix color table to the same used for the gray-scale image display (bright blue and bright red, respectively).
Did restructuring of the PixelAttributes classes for efficiency, consistency, and readability.
Modified the code to allow fpack-compressed FITS files with multiple image extensions to be read in as comparator images. (The fpack-compressed FITS files have the .fz extension at the end of the filename.) Thanks to Sarah Eve Roberts for raising this issue.
v. 2.6.9 (4/24/17)
Fixed the code that auto-detects a header line in the source list, which was not working because of a subsequent switch to a different token-reader function that does not generate an InputMismatchException where the auto-detection was previously handled.
v. 2.6.8 (4/4/17)
Upgraded the software to handle images with CTYPE1 = ‘RA—TPV’ and CTYPE2 = ‘DEC–TPV’ specified for the world-coordinate system.
v. 2.6.7 (3/20/17)
After discussions with Dave Shupe, who now believes the linear and constant terms of the SIP distortion are indeed necessary, modified the code to use them. For images where this is important, APT now computes positions that more closely match DS9 when the world-coordinate system requires SIP-distortion corrections.
v. 2.6.6 (2/9/17)
Added the “cubehelix” color table for image display. Thanks to Dave Irey for this suggestion.
v. 2.6.5 (1/26/17)
Modified the “Export Photometry Data to CVS File” function under the File menu-bar category to optionally output one additional custom column, based on the FITS-header values associated with the images listed in the photometry-data file for a specified keyword. This is useful for time-domain astrometry, where it is desirable to have an MJD column in the results table. Thanks to Stijn De Vusser for this suggestion.
v. 2.6.4 (6/22/16)
Added option to Preferences menu to choose between two different sizes of crosshair mouse cursor, regular (default) or large:
Preferences > Set Image-Display Attributes > Crosshair-Cursor Type
The crosshair cursor is seen when hovering over the main image-viewing panel. The large size is a customized version, and may not work under Mac OS X El Capitan.
v. 2.6.3 (5/2/16)
Modified the software to handle fpack-compressed FITS files with multiple image extensions. (The fpack-compressed FITS files have the .fz extension at the end of the filename.)
v. 2.6.2 (4/29/16)
Modified the software to read in fpack-compressed FITS files directly, for images having a wider variety of BITPIX values. Only the first image extension is handled in this version (handling mulitple image extensions is deferred to a later version).
v. 2.6.1 (4/28/16)
Modified the software to read in fpack-compressed FITS files directly. Only .fz files with images having BITPIX=-32 are handled at this time. Only the first image extension is handled in this version (handling mulitple image extensions is deferred to a later version). Thanks to Tom McGlynn (NASA/GSFC) for helping make this happen, and thanks to Edward Gomez (LCOGT) for pointing out the need for this new capability.
v. 2.6.0 (3/24/16)
Added a new tool that computes the angular distance between two points on the sky, which is now available as the “Angular Distance Calculator” via the menu bar under the “Tools” menu.
Made source-code and tool-panel-layout improvements.
Bug fix: Modified the software to wrap around the negative values in the positive range when reading in FITS images with BITPIX=8. Thanks to Richard Kron for reporting this problem.
v. 2.5.9 (12/8/15)
Performed source-code restructuring in some existing class files.
Added more bullet-proofing to the GUI of the source-list tool.
Added code to catch an ArrayIndexOutOfBoundsException that may occur when optionally median filtering the local non-annulus sky background for a grid size that is too large relative to the input image size.
Replaced the “Exit Preferences Menu” option with a “Close” button.
Modified the FITS reader to be robust against BZERO header lines with an extraneous zero at the line end. This is not FITS standard, and apparently is generated by MaxIm DL or ATIK-camera software. Thanks to James McNamara and Dario Castellano for reporting this problem.
v. 2.5.8 (9/4/15)
Modified the FITS-image reader to be robust against cases where GAIN = ‘unavail’. Thanks to Lucimara Martins for reporting this problem.
Modified the code to write the entire input-image FITS header to the output FITS file containing the non-sky-annulus local background image from sky Model F (except for BZERO and BSCALE, which are seldom if ever used for a 32-bit floating-point image).
v. 2.5.7 (8/25/15)
Bug fix: Eliminated the redundant header line in the output photometry file that occurs for automatic source-list processing when maximumNumThreads=1 (this was thought to be fixed in the previous version, but the fix was incomplete).
Added the capability of optional 3×3, 5×5, or 7×7 median filtering to coarse gridpoints in local non-annulus sky-background estimation (new user preference called “localNonAnnulusSkyBackgroundFilterType”).
Renamed (previously badly named) user preferences “localNonAnnulusSkyBackgroundSourceGridSize” and “localNonAnnulusSkyBackgroundSourceWindowSize” to simply “localNonAnnulusSkyBackgroundGridSize” and “localNonAnnulusSkyBackgroundWindowSize”, respectively.
Added new -b option to the batch-mode command, so that a non-default path and filename for the local non-annulus sky background can be specified.
v. 2.5.6 (8/20/15)
Modified the source-list tool to keep the source numbering in the output photometry file consistent with the input source list for automatic source-list processing when maximumNumThreads=1 (this already has been implemented for maximumNumThreads>1). This change is necessary to handle cases where input sources may not be in the input image, even though the processing is input-list sequential for maximumNumThreads=1. Also, eliminated the redundant header line in the output photometry file that occurs for automatic source-list processing when maximumNumThreads=1. Thanks to Santiago Serrano for reporting these issues.
Added function getFluxFormatDescriptor to the FormatUtilities class to handle only formatting the flux and flux-uncertainty values written to the output photometry file (APT.tbl by default).
v. 2.5.5 (8/5/15)
Modified the software to catch a HeadlessException when getting the splash screen. Thanks to Santiago Serrano for apprising me of this problem.
Modified the non-scientific-notation format of the flux and flux uncertainty written to the output photometry file (APT.tbl by default) to always have 6 digits of precision. Thanks to Kym Hill for finding this problem.
v. 2.5.4 (7/31/15)
Fixed a bug that was preventing the embedded images from being displayed in the software documentation included in the package (which is access via the “About & Help” button).
v. 2.5.3 (7/17/15)
Fixed a bug in the code that writes the non-sky-annulus local background image from sky Model F to a FITS file (needed to explicitly set BITPIX = -32).
Made it so the color-table panel is not displayed with running APT in the batch mode with the source-list tool.
v. 2.5.2 (7/13/15)
Modified to catch IllegalComponentStateException at edu.caltech.ipac.apt.APT.actionPerformed(APT.java:1537), which results when the “Save Preferences” menu option is selected and the “Color-Table Levels” window is closed. Thanks again to Kym Hill for helping to diagnose this problem.
Added option to the “Preferences” menu for dynamically selecting the GUI size (full or compact). Now, environment variable APT_COMPACT only controls the GUI size only when “compactFlag” is missing from the user-preferences file. Also, made it so the GUI size specified in the user-preferences file is only used when “compactFlag=false”.
Removed extraneous code.
v. 2.5.1 (7/6/15)
Modified to catch IllegalComponentStateException at ControlJFrame.displayColorTablePanelDetached(ControlJFrame.java:5983), which results when APT.bat is executed with the -i option on the command line. Thanks to Kym Hill for reporting this problem.
v. 2.5.0 (7/2/15)
Improved the layouts of the control panels for scatter and histogram plots. Modified the scatter and histogram plotting to allow multiple data series.
Added new capabilities for generating pie charts, bar charts, and density (2-D histogram) plots.
Improved the layout of the thumbnail-image control panel, including the addition of a “Close Window” button.
Upgraded the “rainbow” color table to have improved eye discrimination among shades of green.
Added new “terrain”, “heat”, “circus”, and “liberty” color tables for false-color image display (the latter is just in time for July 4th!).
Corrected the code for proper interactions between the “Color-Table Toggle” button and the display mode & level type that are selected in the “Preferences” menu.
Modified the color-table panel to pop up when a new image is loaded, and to save its screen location in the user preferences.
Wrapped the radial-profile plot in a scroll pane, in order to prevent the plot from becoming very tiny, which sometimes happens for users with small computer screens.
Increased the stroke width of the aperture overlay on the main image-viewing panel by 25% for greater visibility.
Reorganized the controls on the “Source-List Tool” panel. Disabled all buttons on the “Source-List Tool” panel during automatic source-list processing.
Did some restructuring to simplify the code base.
v. 2.4.9 (4/10/15)
Fixed quantization errors in data-to-color assignments for the displayed image.
Augmented the software with the new capabiliby of zooming in on the image displayed on the main GUI panel.
Added package statements to all Java source-code files (finally!).
Developed an ant build script to streamline building and packaging.
Modified the scroll-bar policy to have the scrolls bars always appear.
Added a custom crosshair cursor, so that the cursor’s hot spot can be fine-tuned (works on Macs only).
Added a new “Find Aperture” button to reposition the image scroll bars so that the overlaid source is centered.
Modified the software to propapgate the (R.A., Dec.) of the aperture to the constructor of the “Position Locator” panel.
Fixed an indexing bug in the image exporter that was causing a single row and column of pixels through the image center to be skipped.
v. 2.4.8 (6/9/14)
Added code to try to prevent the graph on the radial-profile tool from unexpectedly iconifying (as this rarely happens on some machines, depending on the operating-system version and possibly screen size).
v. 2.4.7 (3/7/14)
Minor bug fix: On the “Export Photometry to CSV File…” panel, grayed out the “Include FITS header in CSV File?” checkbox if an image is not open.
Minor bug fix: In the main class, eliminated many unnecessary class attributes by localizing their scope.
Solved the long-standing annoying Mac behavior of resultant grayed-out menu-bar items after changing certain settings in the “Preferences” menu.
v. 2.4.6 (2/20/14)
Added one more digit of precision to the decimal representation of (RA, Dec), in order to accommodate projects with high astrometric accuracy.
Modified the software to explicitly load an aperture correction of unity when “Manually Set Aperture Correction” is the aperture-correction mode selected in the user preferences.
v. 2.4.5 (2/7/14)
Increased the maximum allowed aperture radius from 200 to 1000 (you have to key in the larger value into the text fields, as the sliders encourage values less than or equal to 200). Large apertures compute slowly, so caveat emptor and patience!
Minor bug fix: Added function call to make the “Recompute Photometry” button’s text turn the color red when “Aperture-Correction Mode” in the “Preferences” menu is selected.
Bug fix: The default source-list filename failed to load into the “Source-List Tool” panel when “Enable Automatic Source-List Creation With Inputs From Saved Preferences or Default Values” in the “Preferences” menu is selected, and the option to compute the aperture corrections now is selected — this thread-concurrency problem is now fixed.
v. 2.4.4 (12/13/13)
Minor bug fix: Modified the software to be able to read in real keyword values that are enclosed in single quotes.
Minor bug fix: Modified the position-locator tool to load the image of the located aperture position into the elliptical-aperture-attributes panel, so that the located position can be visualized there for purposes of aperture resizing and reshaping.
v. 2.4.2 (10/1/13)
Modified the FITS-image reader to handle FITS images with no white space between keyword values and forward slash of keyword comment. Thus, the software now handles FITS files with world-coordinate systems generated by SBIG’s CCDSoft program. Thanks to Adam Rengstorf for bringing this to light.
v. 2.4.1 (9/27/13)
Minor bug fix: Added the input parameters for source-list creation to the subroutine that initializes the installed default values, which was preventing source-list creation in the batch mode when preferences were not saved. Thanks to Oliver King for finding this problem.
v. 2.4.0 (9/18/13)
Added a check box to the “Source-List Tool” panel to optionally overlay small circles on the image in the main image-viewing panel that correspond to source-list positions. Also, added a user-preferences option under “Set Image-Display Attributes > Overlay Color” to change the overlay color; the default overlay color is green. The source overlays will be displayed as long as the “Source-List Tool” panel has not been either reopened with the “Source List” button or closed with the “Close Window” button and the aforementioned box is checked.
Minor bug fix: Updated APT.csh and APT.bat to handle up to 10 input arguments for full batch-mode control (this was an oversight in the previous version).
v. 2.3.9 (9/16/13)
Modified the ApertureCorrections class to use the local non-annulus-based background image computed from modal values, instead of median values.
Cleaned up some obsolete code in the ImageCalculator class.
Added new “-p” command-line option to the available options, which is for specifying a user-preferences filename for the APT session:
APT.csh -i input_FITS-image_filename
        -p user_preferences_filename
        -s input_source_list_filename or "sourceListByAPT" for automatic source-list creation
        -o output_aperture-photometry-table_filename
        -z zero_point
        -h (help switch for available command-line options)
Added logic to limit the window size of the local-statistics calculations to be no bigger than half the smallest image dimension.
Modified the software to include the width and height of the main GUI as user preferences. Thanks to Dave Irey for this suggestion.
Added an option to the “Export Photometry Data to CSV File” tool to write the FITS-header keywords and values to the header of the output photometry-data table.
v. 2.3.8 (9/5/13)
Added an option to the “Export Photometry Data to CSV File” tool to write the user preferences to the header of the output photometry-data table.
Modified the “Sky Annulus” button on the “Elliptical-Aperture Attributes” panel to be disabled when the “Photometry Major Radii” panel is open. Similarly, modified the aperture-attributes button on the “Photometry Major Radii” panel to be disabled when the “Elliptical-Aperture Attributes” panel is open.
Added an “Export Contents” button to the “Photometry File” panel.
Minor bug fixes: Disallow more than one instance of the panel that lists the user preferences (affects Macs only). Ditto for the “Export Photometry Data to CSV File” panel.
v. 2.3.7 (7/11/13)
Moved the image statistics from on the histogram plot to the bottom of the image-histogram panel and increased the font size from 10 pt to 18 pt.
Modified the software to compute and display additional image statistics: skewness, kurtosis, and Jarque-Bera Test.
Changed the display of the image statistics and domain axis of image histogram to honor whether or not scientific notation is allowed by the user.
v. 2.3.6 (5/31/13)
For the “Load Preferences” option under the “Preferences” menu, replaced the JFileChooser class with the FileDialog class, and verified that, for this option only, the Swing-AWT class replacement eliminates the known Mac-only issue of unwanted graying out of menu-bar options.
Bug fix: Regarding the “Save Prefences” option under the “Preferences” menu, changes for Macs only in the last version omitted the directory and caused preferences to be saved in the current directory rather than the selected directory.
v. 2.3.5 (5/30/13)
Added a check box on the “Source-List-Creation Tool” panel to disable source de-blending. Thanks to Sergio Chueca Urzay for suggesting this new option.
Added a new detached panel for holding a copy of the buttons at the bottom of the main GUI panel, in order to make them accessible on inexpensive Notebook computers with small screens that cut off the bottom of APT’s main GUI. The new panel can be viewed via the new drop-down menu option called “Photometry Button Panel” under the “View” menu-bar category. This new “View” menu option has been given the keyboard shortcut of “Command-b” for Macs and “Control-b” for Windows machines. Thanks to Carol Ivers for suggesting this upgrade.
For non-Mac machines, renamed the “Exit” option under the application menu bar to “Quit”, in order to make the option name the same as for Mac applications, so that the documentation can be uniform.
In order to resolve an issue experienced by Mac users only, the quit option under the Mac-provided application menu, which has the keyboard shortcut of command-q, was modified to terminate APT unconditionally (rather than being asked whether you are sure you want to quit). Although it is not well documented, this option apparently issues a quit event only once, and the software behavior becomes unpredictable afterwards. This change obviates that unpredictability.
For the “Save Prefences” option under the “Preferences” menu, replaced the JFileChooser class with the FileDialog class, and verified that, for this option only, the Swing-AWT class replacement eliminates the known Mac-only issue of unwanted graying out of menu-bar options. Mac users will continue to experience this issue until all Swing-AWT class replacements under the “Preferences” menu have been made. The workaround for Mac users is to make changes to settings under the “Preferences” menu, save the changes to APT.pref in the hidden directory .AperturePhotometryTool in the user’s home directory, and then quit and restart the application.
Bug fixes: Restructured some code to make source-algorithm Models 1 and 2 work properly. Modified the radial-profile tool to skip saturated pixels in the data fitting, which should also improve the performance of Models 1 and 2. Thanks to Mogens Bildsoe for pointing out the problems.
v. 2.3.4 (5/11/13)
Added a source de-blending algorithm to the “Source-List-Creation Tool”, which looks for peaks in aggregated image objects that are in accordance with the selected radial-profile sigma, a new input parameter on the “Source-List-Creation Tool” panel.
Added an new “Export Photometry Data to CSV File” option under the File menu-bar category, which has been given the keyboard shortcut of “Command-p” for Macs and “Control-p” for Windows machines. Thanks to Ross Cutts for suggesting this upgrade.
Added a keyboard shortcut for clearing the current output aperture-photometry file, which is “Command-c” for Macs and “Control-c” for Windows machines.
Added a keyboard shortcut for bringing up the “More Settings” panel, which is “Command-m” for Macs and “Control-m” for Windows machines.
Added a keyboard shortcut for bringing up both the “Aperture Size, Shape, and Angle” and “Photometry Major Radii” panels, which is “Command-a” for Macs and “Control-a” for Windows machines.
Modified the software to write the Model-F non-annulus-based sky-background image to a FITS file in the scratch directory with filename skyBackgroundModelF.fits.
Modified the “Simple Photometric Calibration” tool to select only unambiguous matches (i.e., a source in list A was matched with a source in list B, each matched only once to each other).
Added a progress bar to the “Simple Photometric Calibration” tool.
Modified the software to do a nonlinear data fit to the radial-profile model and additionally compute sigma, as well as the linear model parameters, in order to minimize the chi-squared function of the data fit.
Defined a new column in the output aperture-photometry table called “RadialProfileFWHM”, in order to store the radial-profile model’s full width at half maximum (FWHM).
Minor bug fix: Added logic to reset the computed FWHM to approximately 2.35 times sigma for divergent cases where the radial profile’s half-width is determined to be greater than 3.0 times sigma or greater than the domain of the data used to derive the radial profile.
Minor bug fix: Modified the “Source-List-Creation Tool” to allow the input parameter “Number of image-edge pixels to skip” to be as little as zero (previously it was constrained to be one or greater).
Major bug fix: The “Preferences” menu option of automatically computing the aperture correction without the input dialog was broken and needed fixing.
Major bug fix: The yes/no dialogs for Windows and Linux machines were wired backwards (as a result of the button reordering that was done in a previous recent version).
Major bug fix: The “Export Image Data to Image File” option under the “File” menu-bar category was not hooked up and, therefore, this option was non-functional.
v. 2.3.3 (4/11/13)
Bug fix: Added missing code that prevented source-list creation via APT’s command-line batch mode.
Bug fix: Removed the call to APT’s JFrame.dispose() just before the System.exit( 0 ) call, so as not to wait for any APT threads that may be running to terminate, which ensures that APT and the JVM completely terminate upon user request.
Bug fix: A new bug (Windows and Linux only) was introduced in the last related to the “A”, “B”, “C”, “Cancel” button re-ordering on the “Open Image” dialog, which prevented it from working properly the second time around.
v. 2.3.2 (4/2/13)
Modified the software to output a list of available command-line options when the software is executed in a terminal window with the -h switch (for help).
For a ds9-like command line, modified the software to allow “-i” to be optional when specifying the input FITS-image filename as the first command-line argument. Also, modified the software to allow “-s” to be optional when specifying the input source-list filename as the second command-line argument. These two changes both retain the old command-line style (e.g., “APT.csh myImage.fits mySourceList.txt”), while allowing the new command-line style (e.g., “APT.csh -s mySourceList.txt -i myImage.fits “), which does not require the command-line options to be in any particular order.
Modified the “Primary-Image Thumbnail” panel to display grid-line sky coordinates labels in either decimal or sexagesimal, depending on the celestial-coordinates units selected in the “Preferences” menu.
Made code changes to get under control the writing of extraneous table headers to the output aperture-photometry-table file.
Modified all JOptionPane dialogs to have the same button ordering across different platforms (e.g. Macs vs. Windows and Linux machines).
Speeded up the “Aperture-Correction Tool” by replacing the single-threaded code for computing the thresholded and local background images with multi-threaded classes having similar functionality.
Speeded up the “Source-List-Creation Tool” by replacing the single-threaded code for computing the thresholded and local background images with multi-threaded classes having similar functionality.
Changed the progress-bar type from indeterminate to determinate for the “Source-List-Creation Tool”.
Modified the “Source-List-Creation Tool” to not issue a file-overwrite warning if the source-list filename is the default filename of “sourceListByAPT.dat”.
Modified the source algorithm called “Model 1” to also perform radial-profile interpolation for saturated pixels.
Added a splash screen to indicate to users that the software requires some time to initialize before the interactive GUI is displayed.
Modifed the “APERTURE-PHOTOMETRY RESULTS” section on the main GUI to display the sky background for the sky algorithm selected (instead of simply displaying the sky median and the average).
Bug fix: Missing line of code “radio5.addActionListener( this );” was preventing the sky algorithm callled “Model E = Sky-annulus mode subtraction” from being selected and enabled.
Updated this documentation and added paragraph breaks to make it more readable.
v. 2.3.1 (3/19/13)
Implemented a new sky algorithm called “Model F” that uses a local estimate for the sky background that is non-annulus-based and computed via bilinear interpolation of the mode statistic computed with a user-specifiable window size on a user-specifiable grid size (the median statistic is used instead if the window is less than 33 pixels).
Modified the “Aperture-Correction Tool” dialog to always be on top when executed in the automatic mode that uses stored preferences or default values as inputs and bypasses user interaction.
Modified the actions prompted by the “Clear Picks/Zaps”, “Hide/Show Aperture”, and “Close Window” buttons on the “Pick/Zap Tool” panel to include repainting the main GUI’s image-viewing panel so that any new zaps (or cleared zaps) are also shown there immediately (without having to wait until after the “Recompute Photometry” button is clicked.
Added a keyboard shortcut for setting the output aperture-photometry-table filename using a File-Chooser Dialog, which is “Command-s” for Macs and “Control-s” for Windows machines.
Changed the format of APT’s command line for batch-mode operations, in an effort to make APT more useful to power users. The command-line options must now be named, and no longer depend on the ordering of the command line. In this version, there are four different command-line options available:
Unix machine:
APT.csh -i input_FITS-image_filename
        -s input_source-list_filename
        -o output_aperture-photometry-table_filename
        -z zero_point
Windows machine:
APT.bat -i input_FITS-image_filename
        -s input_source-list_filename
        -o output_aperture-photometry-table_filename
        -z zero_point
At a minimum, the -i option must be specified for the command-line options to be useful. No GUI will be displayed when both -i and -s options are specified (batch mode). The -z and -o options are optional.
Added a new column to the output aperture-photometry-table file, which is associated with the output of the new sky algorithm called “Model F”: SkyLocalNonAnnulusBkg.
Bug fix: Speeded up dramatically the image display when loading a new image.
v. 2.3.0 (3/1/13)
Interchanged the positions of “Thumbnail” and “Source List” buttons, in order to better align these functions with the work flow (the former is a visualizer and the latter a results generator).
Switched from System property “mrj.version” to “os.name” for determining whether the host machine is a Mac.
Replaced the deprecated Mac code for handling the About, Preferences, and Quit options under the application’s menu on the menu bar with the up-to-date handlers.
For Mac machines, moved the Preferences menu to under the standard application menu (this is normal for Mac applications).
Moved the “Preferences” menu to the top of the list under the Edit menu on the menu bar for non-Mac machines.
Deprecated the preference called “apertureCorrectionsSourceDetectionThreshold”, and renamed it to “apertureCorrectionsBrightSourceDetectionThreshold”.
Added the following new preferences to the “Aperture Corrections” dialog: “apertureCorrectionsFaintSourceDetectionThreshold”, “apertureCorrectionsMaxPeakToCentroidDistance”, and “apertureCorrectionsSaturationLevel”.
Changed the default values for the following input parameters for the “Aperture-Correction Tool”: Largest aperture radius for which to compute an aperture correction, from 40 to 15 pixels; Minimum nearest-neighbor-source distance, from 40 to 30 pixels.
Added a Preferences option for APT’s interactive mode (non-batch mode) to compute aperture corrections (truly) automatically with input parameters from saved preferences or default values, so that, optionally, no user interaction is required in computing aperture corrections.
Added a keyboard shortcut for opening up a FITS image using a File-Chooser Dialog, which is “Command-o” for Macs and “Control-o” for Windows machines.
Added a keyboard shortcut for quitting the application, which is “Command-q” for Macs and “Control-q” for Windows machines.
Added a keyboard shortcut for poping up the Preferences menu, which is “Command-, (comma)” for Macs (as is normal), and “Alt-p” for Windows machines (for techical reasons, this is a keyboard mnemonic rather than an accelerator key).
Added a keyboard shortcut for poping up software documentation, which is “Command-d” for Macs and “Control-d” for Windows machines.
For non-Mac machines, added the new menu-bar category “APT”, and added under it the menu options “About APT”, “Preferences” (removed from the “Edit” menu), and “Quit APT” (removed from the “File” menu), in order to simulate the equivalent Mac behavior (which makes perfect sense).
For non-Mac machines, added keyboard mnemonics for all menu-bar categories: “Alt-a” for APT menu, “Alt-f” for File menu, “Alt-e” for Edit menu, “Alt-v” for View menu, “Alt-t” for Tools menu, and “Alt-h” for Help menu (keyboard mnemonics are recommended against in the Java Development Guide for Mac).
In the Preferences menu, moved “List Preferences” to just before “Load Preferences”.
Feature fix: Converted HDU number from a zero-based counter to a one-based counter when displaying the HDU number in the FITS-header listing.
Bug fix: Forgot to close old output photometry file before new output photometry file is opened.
v. 2.2.9 (2/15/13)
Modified the software to interrogate the computer for the number of available CPU cores and, by default, set the maximum number of threads to this value for multithreaded processing by the “Source-List Tool”.
Increased the selection in the drop-down menu for the maximum number of threads (under the Edit > Preferences menu) to include all values from 1 to 20 threads.
Modified the “Source-List Tool” to assure that the aperture-photometry outputs have the same ordering as the input source list.
Modified the software to use the local mode as a local backgound estimator when the window size is 33 or greater, and the local median otherwise (local image statistics are required by both the “Source-List-Creation Tool” and the “Aperture-Correction Tool”.
Updated the documentation to reflect the new column names of the output aperture-photometry table.
Typo fix: Changed column name “Sky_RMS” to “SkyRMS” (one intent of the related changes in the previous version was to get rid of the underscores).
Annoying-feature fix: added logic to disallow function lookUpAndSetApertureCorrection() from setting an aperture-correction value that is less than 1.0. Modified the “Aperture-Correction Tool” to set the aperture corrections to 1.0 in the event no bright, isolated sources are found in the image.
Fixed a scoping bug that was introduced in the last version, which may have been preventing background subtraction from being done properly for the plots associated with the curve of growth, radial profile, and source scatter.
Eliminated some unnecessary screen repainting and speeded up the calculations by almost a factor of 2!
v. 2.2.8 (2/7/13)
Added the red and green APT logo as an icon to the APT.exe Application file for Windows.
Added to the Preferences menu new options for setting the image-data saturation level and color for displaying saturated pixels, and modified the pixel-attributes class to display saturated pixels with the designated color when gray scale is selected or alternatively light gray if false color is selected.
Developed a new option to automatically compute the aperture correction as a function of aperture radius (the “Aperture-Correction Tool”), and lood the correct value into the aperture-correction textfield on the “More Settings” panel (the output list of bright, isolated stars is written to brightIsolatedStars.dat in the scratch directory, and the output table of aperture radii, normalized curve-of-growth values, aperture corrections, and uncertainties is written to apertureCorrections.dat in the scratch directory).
Commented out the code that draws an image bounding box for indicating the image region that has been refreshed with the latest stretch and color-table settings (this is more of an annoyance than of any help).
Renamed the column headings in the output aperture-photometry table to simpler, more intuitive names.
Added an indeterminate progress bar to the “Source-List-Creation Tool” panel.
Fixed various bugs in the logic that checks the input-parameter values of the “Source-List-Creation Tool”.
v. 2.2.7 (1/6/13)
Minor bug fix: disallow multiple “Photometry File” panels (previously, only the last one created was active while the rest were zombies).
Modified the numerical formats in the output photometry file so that both Magnitude and Mag_unc always have 4 decimal places to the right of the decimal point.
Modified the “Photometry File” panel so that the “Close Window” button has the input focus; did the same for other panels.
Added a “Clear Contents” button to the “Photometry File” panel.
Increased the widths of the “X”, “Y”, “X_cen” and “Y_cen” columns in the output-photometry-table file by 3 spaces, in order to potentially handle very large images.
Reduced the size of the “Source-List Tool” panel from 950×630 pixels to 700×580 pixels, in order to make it less cramped on smaller computer screens.
Reduced the width of the “Source-List-Creation Tool” panel from 850 pixels to 700 pixels, in order to make it less cramped on smaller computer screens.
Increased the height of the “Simple Photometric-Calibration Tool” from 640 pixels to 770 pixels, as it was somewhat undersized.
On the “Source-List Creation Tool” panel, increased the defaults values of the “Source minimum number of pixels” and “Source maximum number of pixels” from 5 and 100 to 20 and 10000, respectively.
Modified the “Close” button on all graph panels to have the input focus.
On the “More Settings” panel, renamed sky algorithms from “Model B = Sky-median subtraction” and “Model D = Sky-average subtration” to “Model B = Sky-annulus-median subtraction” and “Model D = Sky-annulus-average subtration”, respectively, in order to make it clear that these are local calculations involving the sky annulus.
Added new sky algorithm “Model E = Sky-annulus-mode subtraction”, and added new “Sky_mode/pix” column to the output-photometry-table file.
Added tool tips for the radio buttons on the “More Settings” panel.
Added a progress bar to the source-list tool.
Added dialogs to warn the user when the source-list tool is executed either before a source list has been specified or when there are no sources to process.
Modified the source-list tool’s “Automatically Process Source List” button to be disabled while processing the source list.
Made changes to the source-list tool to prevent a NullPointerException when the “Step Through Source List” button reaches the end of the list.
Changed the default representation of the sky coordinates from sexagesimal to decimal (this is better for students).
Modified the source-list creation code to skip a user-specifiable number of pixel rows and columns from the image edges, in order to avoid source detections near image edges.
v. 2.2.6 (12/6/12)
Bug fix: was getting a PatternSyntaxException on Windows machines when running the “Screenshot” tool, but fixed this by performing character replacement instead of the same with a regular expression.
Minor bug fix: disallow multiple “Pick/Zap” panels (previously, only the last one created was active while the rest were zombies).
Minor bug fix: the “Pick/Zap” panel was slightly undersized on Windows machines for APT_COMPACT=0, and so increased the panel height to 835 pixels.
Added the aperture-attributes button back to the main GUI panel, and rewired it to pop up both the “Elliptical-Aperture Attributes” panel and the “Photometry Major Radii” panel.
Added code to automatically increase the major radii of the sky annulus to 5 pixels bigger than the aperture when the aperture attributes are changed.
Added an “Exit” option under the File menu-bar category for non-Mac machines.
Augmented the software with a function that computes full-width at half-maximum (FWHM) of the radial profile, in pixels, and added a display of this value to the “Radial-Profile Plot” panel.
Added functionality to the thumbnail panel to compute the number of pixels contained in a rectangular box (in addition to the integrated intensity, which was introduced in the previous software version), which is drawn in yellow when the mouse cursor is dragged across the thumbnail image (the image-overlay graphic, consisting of the yellow box for intensity integration and its green diagonal for distance measurement, is hereby dubbed “Laher’s square”!).
Made code changes to considerably speed up the loading of pick/zap masks.
Added code to control the precision of the numbers displayed on the “Pick/Zap”, “Primary-Image Thumbnail”, and “Image Comparator” panels.
Limited the maximum size of the thumbnail image to no less than 500 pixels.
Added arbitrarily orienting image-slice functionality to the “Primary-Image Thumbnail” panel, and when a user clicks on a curve feature in the slice plot, a small circle will be drawn around the corresponding source in the thumbnail image.
Modified the font style and color to be bold and blue for the magnitude and magnitude uncertainty on the main GUI panel, in order for these primary results to stand out.
Modified the software to briefly display the magnifier image centered on the location of the aperture was overlaid or snapped, which will linger until the mouse cursor is moved.
Updated the software documentation to reflect this upgrade.
v. 2.2.5 (11/16/12)
Bug fix: added additional logic to assure that boolean ellipseLockFlag is reset to true and ellipseRotationAngle is reset to zero when the aperture major and minor radii are determined to be equal when the preferences are loaded.
Bug fix: corrected the software to write the aperture-photometry results to the selected aperture-photometry-table file when the filename is changed via the “Set Photometry-Table Filename” of the “Preferences” menu.
Bug fix: needed to update the spinners on the elliptical-attributes panel when an aperture is overlaid at a different image location.
Minor bug fix: modified the code to update the aperture graphic on the main GUI panel when the aperture size and shape is changed on the “Elliptical-Aperture Attributes” panel.
Minor bug fix: disallow multiple “Source-List Creation Tool” panels (previously, only the last one created was active while the rest were zombies).
Added functionality to the thumbnail panel to compute the integrated intensity contained in a rectangular box, which is drawn in yellow when the mouse cursor is dragged across the thumbnail image.
Reformatted the information contained in the GUI section entitled “APERTURE MEASUREMENTS” for readability.
Moved the functionality to set the aperture attributes and photometry major radii from the main GUI panel to under the Edit menu-bar category, in an effort to declutter the interface and eliminate confusing software behavior.
Moved the seldom-used “Image Comparator” button from the main GUI panel to under the View menu-bar category.
Added a “Clear Picks/Zaps” button to the Pick/Zap Tool.
Added a “P/Z Mask” button to the Pick/Zap Tool, where the underlying functionality is to either save a pick/zap mask or to read in a previously saved pick/zap mask (which will subsequently be loaded into the Pick/Zap display if the aperture is in the vicinity of the stored absolute locations).
Moved logic to check source-list file existence to where the data are actually saved before overwriting the file.
Modified the “Apply” button on various panels to have input focus, and have its text change red when a setting is changed or a text field is clicked.
Renamed menu option “Set Photometry-Table Filename” to “Set Photometry Filename” and moved it from the “Preferences” menu to under the File menu-bar category.
Added a sky-annulus graphic to the “Elliptical-Aperture Attributes” panel.
Modified the Pick/Zap Tool to zap by default, rather than pick.
Updated the software documentation to reflect this upgrade.
Thanks to Chris Krstanovic who suggested some of the improvements in this upgrade, including the idea of pick/zap masks!
v. 2.2.4 (11/5/12)
Bug fix: disabled Java version checking in APT.exe, which prevented APT launching and needs more work before reinstatement.
Bug fix: found a couple of instances where pixel values were mistakenly formatted in scientific notation when the scientific-notation option was deactivated.
Implemented code to automatically snap the aperture to the source centroid and enabled it as the default behavior, and also added a check box on the “More Settings” panel to disable it (which is sticky if user preferences are saved).
Added an extra place to the right of the decimal point for displaying (R.A., Dec.) values on the main GUI panel.
Reformatted the information contained in the GUI sections entitled “VALUES UNDER CURSOR” and “APERTURE-PHOTOMETRY RESULTS”, in order to right-justify the data values to make the data display more readable.
Fixed some tool-tip text mistakes and omissions.
v. 2.2.3 (10/31/12)
Bug fix: modified APT.csh to prepend “$APT_HOME/” to the 6 instances therein of “APT.jar”, which will allow this C-shell command to launch APT from a directory other than where this C-shell script and associated APT.jar file are located.
v. 2.2.2 (10/26/12)
Added functionality to export a screenshot of the primary image to a file in a choice of the user-selectable formats JPEG, PNG, BMP, or GIF, which can be accessed by the “Screenshot” button on the main GUI panel and the “Export Image Data to Image File” option under the File menu-bar category.
Did some reorganization of the main GUI panel to create a new section entitled “APERTURE MEASUREMENTS”. Moved the Aperture (X, Y) and Centroid (X, Y) labels and “Snap” button to this new section, and also added new centroid (R.A., Dec.) values to this new section.
Added a new preferences option for the user to select whether the display of numerical results in scientific notation is allowed (the default is to disallow scientific notation), and this will determine whether %e or %f print format descriptors are employed (exceptions that unconditionally use scientific notation: largest numbers, image-histogram statistics, and radial-profile parameters).
Changed the label of the section formerly entitled “REAL-TIME RESULTS” to “VALUES UNDER CURSOR”.
Changed the label of the section formerly entitled “PRIMARY-IMAGE PHOTOMETRY RESULTS” to simply “APERTURE-PHOTOMETRY RESULTS”.
Changed the default value of the calculation step size from 0.01 to 0.2 pixels (the same as SExtractor), which will speed up the calculation at the expense of lower sub-pixel resolution.
Renamed the “Get Image” button to “Open Image”, in the interest of standardization.
Added a new option “Open Image” to the File menu-bar category.
Created a new menu-bar category called “Edit” and moved the Preferences menu under it. Moved the “More-Settings Panel” option under the View menu-bar category to under the new Edit menu-bar category.
Fixed a bug that was preventing records from being written to the output aperture-photometry-table file after executing the “Clear Photometry File” function under the File menu.
Modified the software to close the source-list-tool panel when a new image is loaded, which fixed a bug that was allowing the source-list tool to be started before a new image was fully loaded and mismatched results for the old image data and the new image filename.
Added code to trap null exceptions that are raised when trying to display graphs with no data.
Added code to null out the graph data associated with the previous aperture when a new aperture-photometry calculation is made.
Removed experimental code that printed out additional information after the image filename in the output aperture-photometry-table file.
Removed from APT.exe the functionality of running Oracle’s JVM installer (as administration priveleges are generally required).
Updated this software documentation.
Many thanks to Michael Fitzgerald of the Department of Physics and Astronomy at Macquarie University in Sydney, Australia for suggesting many of the changes in this version and the two previous versions, and for helping out with the beta-testing!
v. 2.2.1 (10/04/12)
Implemented code changes to make the software more memory efficient. Created APT.exe to launch APT on Windows machines (only), after ascertaining the path to the JVM or running Oracle’s JVM installer.
v. 2.2.0 (9/29/12)
Modified the packaging of the software to make an executable APT.jar file. Modified the java command in APT.bat to execute the APT.jar file with the required java-command options, and to set APT_HOME to current directory and APT_ARCH=WIN.
v. 2.1.9 (8/13/12)
Upgraded the distance tool on the primary-image thumbnail panel to measure distances in pixels for cases where the world-coordinate system of the primary image is not available.
Modified the software to not display any graphics associated with the sky annulus when sky model A (no sky-background subtraction) is selected.
Upgraded the source-list creation tool to compute the threshold using a local background (median) and local data dispersion (one half the difference between the 84.1 and 15.9 percentiles), and to allow the user to select the grid and window sizes for the local image calculations.
Modified APT’s batch mode to automatically generate a source list if a non-existent file called “sourceListByAPT” is specified as the command-line argument for the source-list file, instead of an actual source-list file (if a file called “sourceListByAPT” actually exists, then it will be used, instead of automatically generating a source-list file called “sourceListByAPT.dat”).
Modified the software to print a message and exit when running APT in the batch mode and either the specified image file or source-list file does not exist.
Increased from 10,000 to 100,000 the number of rows in an output aperture-photometry table that can be viewed via the main GUI panel’s “List Results” button.
Added a conversion from the CD matrix to CDELT1, CDELT2, and CROTA2 to the WCS class, in order to make the Orthographic and Aitoff Projection classes work properly (which currently do not support the CD matrix).
Minor bug fix: disallow multiple primary-image thumbnail panels (previously, only the last one created was active while the rest were zombies).
v. 2.1.8 (7/11/12)
Modified the source-list tool to utilize multithreading when executed in the automatic mode, which involved some code restructuring. Added options to Preferences menu to enable multithreading by setting the maximum number of concurrent threads to a value greater than one.
Added new “Number” column to the output aperture-photometry-table file, in order to keep track of the sources (multithreading will cause the output ordering to be different from the input source list).
Modified the source-list tool to accept input source lists with sexagesimal equatorial coordinates (in addition to equatorial coordinates in decimal degrees, or alternatively pixel coordinates).
Added new “Decimal/Sexagesimal Converter” function, which is now available via the menu bar under the “Tools” menu. Added more bullet-proofing against misuse of the “Position Finder” tool introduced in the previous version (and fixed a very minor bug: declination equal to exactly 90 degrees is indeed possible).
Fixed a bug that was preventing the new color-table panel from being displayed.
Fixed a couple of bugs reported by Dr. Steve Souza: 1) Mag_unc should be set to NaN when Magnitude is NaN; and 2) more spaces between the Magnitude and Mag_unc columns are needed to handle larger values of Mag_unc.
v. 2.1.7 (6/27/12)
Added code to force display of the scroll bars after a new image is loaded (previously, users had to click on the image to display them).
Added code to display a sample aperture and sky annulus in the upper-left corner of the image.
Added code to temporarily display reminder text “CLICK ON IMAGE TO OVERLAY APERTURE”, which disappears after mouse-clicking on the image to overlay an aperture.
Rotated by 90 degrees the labels of the right-ascension gridlines that are optionally displayed on the thumbnail image.
Added tool tips with color levels to the color-table graphic in the lower right-hand corner of the main GUI panel. Developed functionality to quantatively display the color-table levels on a separate panel.
Added new “View” menu-bar item, and under that two options, one for displaying the color-table levels on a separate panel, and the other for displaying the “More Settings” panel.
Implemented new functionality to measure angular separation between positions on the thumbnail image, which works via mouse-cursor drag and release.
Added code to prevent multiple simultaneous instances of the “Elliptical-Aperture Attributes” panel, and the same for the “Default Photometry (Major) Radii” panel.
Added code to make, when the “Elliptical-Aperture Attributes” panel is open, the displayed image move to where aperture happens to be located.
Created the new “Position Finder” tool, which is now available via the menu bar under the “Tools” menu.
v. 2.1.6 (5/23/12)
Added new option under the menu-bar “Tools” menu to write selected primary-image data to a comma-separated-value (CSV) file for importing into Excel (thanks to Lissa Snyders and Tim Spuck for this suggestion).
v. 2.1.5 (5/22/12)
Modified the software to display or undisplay, as appropriate, the temporary zaps in the main image-viewing panel when the either the “Snap”, “Recompute Photometry”, or “Hide/Show Aperture” buttons are mouse-clicked, or when the spinner-controllable text fields for the aperture position are modified, or when a new aperture is overlaid.
v. 2.1.4 (5/18/12)
Enhanced the pick/zap tool so that it picks or zaps blocks of pixels, where the available pixel block sizes are 1×1, 3×3, 5×5, and 7×7 pixels.
Renamed output-photometry-table column “Tilt_aper” to “Rot_aper”, i.e., for the rotation angle of the elliptical aperture (thanks to Dr. Benne W. Holwerda for pointing out this inconsistency).
Modified the source-list creation tool to have a graceful exit when the limit of 100,000 image objects is reached.
Minor bug fix: Modified the software to update the filename label on the “List Results” panel when the user possibly changes the output aperture photometry filename by loading a different preferences file.
v. 2.1.3 (5/9/12)
Added Aitoff-projection capability for equatorial coordinates to enhance APT’s usefulness as a FITS viewer.
Upgraded the gnomonic projection to look for and apply PV distortion keywords generated by SCAMP for the astrometrical calibration (in the absence of the “-SIP” suffix in the CTYPE1 and CTYPE2 settings).
Fixed potentially misleading informational display: the (R.A., Dec.) coordinates of the real-time results were not getting updated when either the “Snap” or “Recompute Photometry” buttons were mouse-clicked on — this is now fixed.
v. 2.1.2 (4/18/12)
Increased the maximum allowed SIP-distortion order from 4 to 9.
Added real-time pixel-value display to primary-image thumbnail panel.
v. 2.1.1 (4/17/12)
Discovered the SIP distortion coefficients were not being properly loaded, which made the distortion correction zero; fixed the problem and verified the new results agree very well with DS9 output.
v. 2.1.0 (2/27/12)
Added optional coordinates-grid overlay to primary-image thumbnail panel, along with real-time cursor-position display.
Modified the software to save the screen location of the main GUI panel in the user preferences, and to locate the main GUI panel at that location when the APT is started up.
Fixed another bug found by Dr. Steven Souza, in which the gain in the user preferences is not applied in the “More Settings” panel when an image is loaded with the GAIN keyword absent.
Added a new “Preferences” menu option called “Set Default Image-Data Gain”, which changes the value of the user-preference “defaultGain” to a user-inputted value.
Improved wording in the “Select Sub-Image Region” dialogue, and made it so it opens up near the main GUI panel (this was overlooked when upgrades were made in the last APT version).
Added new Cartesian-projection capability for handling Hires IRAS images.
Upgraded the source-list tool to correctly transform source lists of equatorial coordinates with orthographically projected images and Cartesian-projected images.
Fixed a precision problem in the Thumbnail object that was causing the thumbnail image to be somewhat smaller than the input image to varying degrees, depending on the selected thumbnail size.
Added logic to assure the computed RA falls in the [0.0, 360.0) range, in degrees.
v. 2.0.1 (1/27/12)
Upgraded APT to be more large-computer-screen friendly. That is, when computer-screen “real estate” is added via a large monitor to supplement a smaller laptop screen and the main GUI panel is moved from the laptop screen to the large screen, it is desirable for subsequent APT panels and dialogues to also open up on the large screen (rather than on the laptop screen).
Fixed the crashing of the source-list tool on source #109 (as reported by Prof.dr. Paul Groot and Dr. Thomas Kupfer of Radboud University Nijmegen, Nijmegen, The Netherlands).
Added code to refresh “Elliptical-Aperture Attributes” and “Image Comparator” panels when color table is changed.
Added more choices of thumbnail size to pull-down menu (to better accommadate my new Thunderbolt display).
Fixed bugs related to reading FITS keyword values as strings to the right of the right-most single quotation mark (e.g., CTYPE1 and CTYPE2, which are required for proper computation of equatorial coordinates).
v. 2.0.0 (12/1/11)
This is a major upgrade, and APT photometry-table files created by prior APT versions are incompatible with the current version.
Added new capability of source-list generation.
Added new capability of elliptical-aperture calculations. Deprecated property “radiusAperture” and created the following new properties: “ellipseMajorRadius”, “ellipseMinorRadius”, “ellipseRotationAngle”, and “ellipseLockFlag”. Replaced column “R_aper” in photometry-table file with “MajR_aper”, “MinR_aper”, and “Tilt_aper” (corresponding to the elliptical aperture’s major radius, minor radius, and rotation angle).
Added new “R_cen” column in photometry-table file for tracking values of the source-centroid radius.
Added new “Preferences” menu option of setting the default physical units of the image data, which is used only when the BUNIT keyword is absent from the FITS header of the image.
To prevent interference with batch mode, suppressed the dialog box that warns the user when cases are encountered for which BUNIT is not found in FITS header and the software subsequently defaults to the default image-data physical units specified in the user-preferences file or, if that is not available, the setting “D.N.”, which stands for “Data Number”.
Raised the maximum number of sources allowed in a source list from 20,000 to 100,000.
Added function call to make the “Recompute Photometry” button’s text turn the color red when Preferences-menu settings under items “Set Photometry Size Parameters” (formerly “Set Photometry Radii”) and “Set Aperture Size, Shape, and Angle” are interrogated and/or modified.
Increased the column widths allocated for “N_aper”, “N_rej”, and “N_sky” in the photometry-table file from 7 to 10 characters.
Added “Show/Hide Aperture” button to panel of “pick/zap” tool.
Modified to select the relevant radio button for defining source-list coordinates when a new preferences file is loaded.
Added capability of performing simple photometric calibration (under “Tools” on the menu bar).
Improved the documentation.
Bug fix: modified the photometry-table loader to allow data lines with “RA” embedded in the FITS filenames!
Minor bug fix: made it so main-GUI-panel changes to the inner and outer sky-annulus radii are incorporated into the property set that is saved in user preferences; previously, changes to these parameters made only under the “Preferences” menu were propagated to the preferences.
Very minor bug fix: repaint magnifer image immediately temporary zaps are cleared (rather than simply waiting for user to move mouse cursor in main image-viewing window).
v. 1.1.1 (4/15/11)
Added new orthographic-projection capability for WISE images.
Major bug fix: Gnomonic projection was one pixel off.
Minor bug fix: limited display of missing-BUNIT-keyword dialog to only once when multi-extension FITS file is loaded.
v. 1.1.0 (4/4/11)
Added new option of histogram equalization to image-display stretch.
Fixed bug: Moved creation of radial-profile, source-scatter, and curve-of-growth plots to after background computation.
Increased the size of the curve-of-growth plot in the vertical dimension to accommadate the long y-axis title.
v. 1.0.9 (3/8/11)
Fixed bug found by Dr. Steven Souza, in which a hard-wired gain value of 1.0 in the HDU class was stepping on the gain value stored in the user preferences, which normally would be used in cases where the FITS header of the primary image does not have a GAIN keyword/value pair.
Subsequently found and fixed a similar problem related to BUNIT in the user preferences.
Added message dialog to indicate to the user cases where the primary-image FITS header does not have a BUNIT keyword/value pair.
Added warning dialog for cases where the user enters a value less than 1.0 for the aperture correction.
Added warning dialog for cases where the user enters a value less than or equal to zero for the depth of coverage.
Fixed bug that was preventing comparator images from being read in.
Added a few more choices for specifying the size of the thumbnail image.
v. 1.0.8 (3/5/11)
Added preferences option to control the size of the thumbnail image, which allows maximum size in the longest dimension to be selected from a menu of discrete values between 300 and 3000 pixels.
Added code to reset the initial image stretch to the image minimum and maximum for cases where the computed image stretch extrema are nearly equal.
The “zoom/pick” tool was renamed the “pick/zap” tool.
Moved the pick/zap tool to a separate panel that is displayed when the “pick/zap” button is pressed, in order to expand the size of the main image-viewing area (and so that the main image-viewing area is enlarged as the main GUI panel is manually enlarged by the user).
Increased the sub-image size of the pick/zap tool from 35×35 pixels to 75×75 pixels.
Minor bug fix: added code to trap null exception in function ImageCalculator.scaleAndOffsetRadialProfile(), which occurs when an aperture is uselessly overlaid onto a sub-image of NaNs.
Enabled the scrollbars to move and center the overlaid aperture in the main-image viewing window for cases where the source of interest is not contained within the viewing window; the usefulness of this new capability is demonstrated when running the source-list tool in the manual mode (note that this capability is disabled in the automatic mode to maximize computing speed).
v. 1.0.7 (11/22/10)
Modified for robustness against FITS files with CTYPE1 = ‘RA—TAN-SIP’ and CTYPE2 = ‘DEC–TAN-SIP’ and missing distortion keywords.
Fixed minor bug that leaves bounding-box remnants in the image display when APT is executed with a FITS filename on the command line.
Added functionality to display a thumbnail image of the primary image that is no more than 500 pixels in the longest dimension. Added a button to the main panel called “Thumbnail” to activate the functionality.
Modified the color of the “Refresh 2” button text from red to yellow as a reminder to the user that the image-display parameters have changed and to click on this button before scrolling about the image (red connotes “mandatory” whereas yellow connotes “advisory”).
Modified the main GUI panel so that when it is enlarged, the main image-viewing panel, located on the upper right of the main GUI panel, increases in size.
v. 1.0.6 (11/4/10)
Modified start-up scripts to invoke java explicitly with U.S. geographical region and English language, so that decimal points in numeric values will always be periods, as opposed to commas which are used in place of decimal points in some foreign countries, like Germany (thanks to Inga Saathoff for bringing this to my attention).
Shortened label “Photometry data units:” to “Photometry units:”.
Made changes to FITS-reader source code to fix NAXIS3 and file-seek bugs, abbreviate certain strings found in BUNIT, and make it so HST ACS “sci” and “drz” images are handled.
Modified software to store as preferences the locations of last image and source list specified. Also modified software to store as preferences all values in the “More Settings” panel, as well as the type of source-list coordinates (an option of the source-list tool).
Added new image-stretch option 0.3%/99.7% (+/-3 sigma about the mean in the case of a Gaussian distribution).
Modified software to NOT reset values in the “More Settings” panel when a new image is read in.
Modified software to reset image-stretch pull-down menu and sliders to their default positions when a new image is read in.
Modified software to run in automated batch mode where image and source-list files can be specified on the command line (e.g., ./APT.csh image.fits sources.lst).
Fixed bugs reported by Dr. Varoujan Gorgian in the beta-testing of this version.
v. 1.0.5 (7/25/10)
Fixed a minor sexagesimal display problem (added leading zero, when appropriate, to seconds in R.A. and arcseconds in Dec.).
Added special logic to set percentiles to minimum if maximum = mimimum.
Modified the initially selected option for the stretch combo-box to 1%/99%.
Modified the program to save and load APT.pref (user-preferences file) in/from hidden directory ~/.AperturePhotometryTool in the user’s home directory. Also, set the initial location of photometry file APT.tbl and the initial location of the scratch directory to hidden directory ~/.AperturePhotometryTool in the user’s home directory.
Modified the scrollbar position associated with the FITS-header display to be at the top of the FITS header rather than at the bottom.
Fixed bug preventing source list with negative values from being read in. Increased the source-list tool’s maximum number of sources from 10,000 to 20,000. Made the source-list-tool window wider to accommodate longer filenames. Changed label “(degrees)” to “(decimal degrees)” for clarity.
Modified text fields for “New image-data conversion factor”, “Image-data units after new conversion” and “Image-data title after new conversion” on the “More Settings” panel to be grayed out unless the “Perform new image-data conversion (see settings below)?” checkbox is checked.
Modified APT.csh and APT.bat to set -mx1024M as the default heap size.
Modified the sky-background calculation to include one iteration of 3-sigma data clipping.
Added capability to specify an aperture correction.
Added capability to specify a magnitude zero point, and modified the software to print out magnitude and magnitude uncertainty in the output photometry-table file.
Modified calculation of source-intensity uncertainty to include depth-of-coverage parameter (important for coadded images).
v. 1.0.4 (6/12/10)
Added capability to launch APT with an input FITS file specified on the command line.
Fix bug that caused width of Zoom/Pick tool to jiggle slightly with mouse-cursor movement.
Added new pull-down menu for setting the lower and upper image-viewing stretch bounds from a variety of choices: min./max.; 0.1/0.999 percentiles, 0.5/0.995 percentiles, 1/99 percentiles, 2/99 percentiles, 3/99 percentiles, 4/98 percentiles, 5/95 percentiles, 10/90 percentiles, and 16/84 percentiles.
Added new functionality for reading in multi-plane FITS images.
Added new functionality for reading in multi-extension FITS images.
Modified the FITS-filename labels to, if applicable, give the HDU number in square brackets after the filename; e.g., PTF201005013661_2_o_12052.fits [3]. The FITS-header viewer, in the case of multi-extension FITS files, now displays the headers of all HDUs.
Modified the FITS-header reader class to be robust against keyword = value pairs where value is blank (null), and special handling to read NAXIS header cards that don’t have a space between value and /comment (Dr. Steven Souza provided sample FITS file created by ImageJ with this problem).
Added interpolation to percentile-selection class for improved accuracy.
Per world-coordinate system standards, assume the image is unrotated if CROTA2 is absent from FITS header while both CDELT1 and CDELT2 are present (thanks to Tom McGlynn of NASA Goddard Space Flight Center for pointing this out).
Previously, the calculational step size for the source-centroid calculation was hardwired to 0.05 pixels, which caused very long computation times for large apertures; to remedy this, the code was modified to allow in the source-centroid calculation larger step-size values if so selected by the user, but impose a lower limit of 0.05 pixels for the step size in the source-centroid calculation.
Removed the upper-limit restrictions on the size of the centroid, aperture, inner-sky and outer-sky radii; calculations with very large radii will possibly take a very long time, and selecting a larger calculational step size will reduce that time somewhat, but I henceforth do not want to disallow such calculations.
Added the following new inputs to the “More Settings” panel: aperture correction (default = 1.0), magnitude zero point (default = 0.0), and depth of coverage (default = 1.0).
Modified the software to compute the aperture-corrected flux, flux uncertainty corrected for depth of coverage (in the case of coadded images), magnitude, and magnitude uncertainty.
Modified the output photometry table to additional columns “Magnitude” and “Mag_unc”.
v. 1.0.3 (3/28/10)
Incorporated into the APT logo the Latin version of APT motto: Inviso notitia (pronunced in-VEE-so no-TIH-tee-a in Classical Latin, according to John Fowler).
Corrections in terminology: 1) Changed “source noise” to “source-intensity uncertainty” in the text of this documentation and “source_unc” for labels and column headings; and 2) Changed “sky noise” to “sky-background sigma” in the text of this documentation and “sky_sigma” for labels and column headings.
Bug fixes: 1) Forgot to also multiply source-intensity uncertainy by optional image-data conversion factor; 2) Made 99-percentile-selection calculation more robust against small numbers of samples.
Changed zoom/pick tool font size for APT_COMPACT=0 from 13 pt to 12, in order to eliminate wrap-around text in the “Zap” textfield.
Implemented basic capabilities for plotting aperture-photometry results in publication-ready format, which is accessed via new “Plot Results” button. Both scatter plots and histogram plots are available. To make room for the new button, renamed “Save Photometry Data” button to “Save Results” and renamed “Show Photometry File” button to “List Results”.
Upgrades: 1) Modified source-list-tool panel to display image-pixel coordinates of current source in manual mode; and 2) Modified source-list tool to allow and auto-detect an optional header line at beginning of input source-list file.
Modified to allow header line in input source list.
Added License and Limitation of Liability sections to this document.
v. 1.0.2 (1/9/10)
Modified GUI-layout parameters to widen main-image viewing panel while keeping the overall GUI width nearly the same; made the GUI width and height 10 pixels larger (now 1390 x 835 pixels).
Added option of displaying more compact GUI with main panel sized to 1220 x 800 pixels (this is suitable for laptops with smaller screens); set environment variable APT_COMPACT=1 before executing APT to get the smaller GUI (APT_COMPACT=0 gives the larger GUI).
Bug fixes: 1) Changed to NOT re-load user preferences when “Color-Table Toggle” button is pressed, which preserves any user changes to centroid, aperture, and sky-annulus radii that have not necessarily been saved as preferences; 2) Fixed typo in label that displays radial-profile model equation in radial-profile panel; 3) Fixed typo in radial-profile model equation given in this documentation; 4) Commented out debug print statements that were sending extraneous information to the console window; 5) Fixed the documention so as not to confuse users between environment variable APT_HOME (where APT is installed) and the user’s home directory; and 6) Increased width of “Source_model” column in photometry-table file so that adjacent column headings “Data_units” and “Source_model” are separated by one space (which allows the column headings to be aligned with the correct data when importing the photometry table into a spreadsheet).
v. 1.0.1 (11/11/09)
Bug fixes: 1) Problem converting negative values of declination from decimal to sexagesimal; and 2) Problem of abrupt termination of APT when clicking on window-frame “x” button to close window that displays photometry file.
v. 1.0.0 (10/16/09)
At last, the long awaited version 1.0.0!
Corrected misspelled “sexagesimal” (thanks for catching that, Seppo!).
Moved menu item “sexagesimal” ahead of “decimal” and made the former the default.
Added function call to make the “Recompute Photometry” button’s text turn the color red when Preferences-menu item sexagesimal vs. decimal is toggled.
Added new Preferences-menu functionality to invert either the gray-scale levels or the color-table levels.
Modified the functionality of the “Color-Table Toggle” to cycle through gray scale, inverted gray scale, false color and inverted false color image displays (color table can be changed via Preferences menu).
Added data fitting to the radial-profile plot; the data-fit model is S(r) = A + B r + C r^2 + D r^3 + E r^4 + F exp( -r^2 / (2 sigma) ), where constants A through F are determined by linear regression and sigma is a fixed parameter that can be manually adjusted to optimize the data fit.
Added capability of using the data-fit model for interpolating across pixels with NaNs/Infs or rejected source outliers in the aperture, in order to fill in missing flux density (“Model 1” source algorithm).
Added capability of automatically scaling and offseting the data-fit model, so that it can be created for one source and then be applied to another source (“Model 2” source algorithm).
Added functionality to change the text on “Hide/Show Aperture” button to either “Hide Aperture” or “Show Aperture”, as appropriate.
Added “Close” button to “About & Help” display panel.
Modified APT upon start-up to read in customized user preferences from a file called “APT.pref” in the home directory.
Modified “Load Preferences” and “Save Preferences” functions in “Preferences” menu to set the default file-chooser directory to the home directory.
Added new “Reset Default Preferences” menu item to “Preferences” menu.
Moved “Clear Photometry File” function from “Preferences” menu to new “File” menu on the menu bar.
Modified photometry-file viewer, which is accessed via “Show Photometry File” button, to display the file contents in a table with cells.
Made “Model A” the default sky algorithm because this is required for properly setting outlier-rejection parameters.
Modified code that prepares data for plotting aperture slices, radial profile, and curve of growth to apply source-threshold outlier rejection within the source aperture and in the region between the source aperture and inner sky annulus, and to apply sky-threshold outlier rejection with the sky annulus.
Updated the documentation.
v. 0.999 (8/24/09)
Upgraded the software to use some of the Spitzer SPOT/Leopard Java classes for conversion from pixel to celestial coordinates. However, only the gnomonic or tangent projection is implemented in APT, and this implementation only handles distortion for cases where CTYPE1 = ‘RA—TAN-SIP’ and CTYPE2 = ‘DEC–TAN-SIP’.
Augmented output photometry table with new columns “RA”, “Dec”, “RA_cen” and “Dec_cen”.
Modified logic that detects reversed lower/upper source and sky data-rejection thresholds to reset to default limits in this case.
Modified logic that detects out-of-range centroid, aperture, and sky-annulus radii to reset photometry results to N/A in this case.
Added “Close” button to FITS-header-display panel.
Modified source-list tool to be much less restrictive: input image-pixel coordinates can now have a fractional component (integers are no longer required). Optionally, the input source list can be a list of either image-pixel coordinates or celestial-sky equatorial coordinates.
Added nifty logo! Modified APT.csh to display the APT logo on the Mac’s software dock.
v. 0.998 (6/22/09)
Modified source-list tool to print out the full path/filename of the source list being processed — this is necessary for traceability.
Changed default centroid radius from 10 to 5 pixels (the lower value is the default aperture radius), so that the centroid calculation will not be affected by outliers in the sky annulus.
Changed logic to allow radius of inner sky annulus to be greater than or equal to the aperture radius (instead of more strictly requiring that the radius of inner sky annulus to be at least 1 pixel greater than the aperture radius).
Added to preferences menu an option for changing the default values for the centroid, aperture, and inner and outer sky annulus radii (the default values are automatically set when a new image is inputted).
Added new option to user-preferences menu called “Set Calculation Step Size”, in which the user can change the calculation step size according to needs or preferences. Altered the default calculation step size from 0.02 pixels to 0.01 pixels.
Modified the “More Settings” panel to have both an “Apply Settings” button and a “Close Window” button, so that, now, the panel can be closed normally, without applying changes to the settings (if so desired).
Improved the method used to exit from APT, since it was reported that, in some cases, the “Exit” button had to be pressed twice, in order terminate the program.
Modified the file chooser when selecting the session’s first image to offer image selection in the directory where APT is executing.
Upgraded the centroid calculation to iterate on successive centroid solutions, up to 100 iterations, moving the centroid’s center to the nearest integer pixel location of the floating-point solution with each iteration, until the solution is converged.
Added code to detect Infs (infinity values) in image data and treat these like NaNs. Added print diagnostic of separate counts of NaNs and Infs in image (STDOUT).
Added image minimum and maximum values to image-histogram plot.
Add Mac-OS-X “About” dialog box and handler.
Added an abstract and a section on bug reporting to this document.
v. 0.997 (2/13/09)
Minor bug fixes: 1) Preferences option “Set Photometry-Table Filename” was not responding because of a name change; 2) Modified software to not display the “Photometry record has already been saved” message when the user does aperture photometry on an image region with all NaNs and then tries to save the photometry calculational result (this can happen when using the Source-List Tool).
v. 0.996 (2/6/09)
Made “live” the text field associated with specifying a string for case-sensitive searching of the FITS header, so that when the enter key is pressed in this text field, the search is performed.
Reorganized source code that computes aperture centroid, source intensity and its uncertainty, sky background, etc. (ImageCalculator class), in order to make it more modular. Created new ExtendedMath class to house the nint() function, and possibly others in the future.
Changed the calculational method of the aperture centroid, so that it now depends only on the local image-data minimum, rather than the sky background.
Added check-box option to do the photometry calculation with the aperture centered on its calculated centroid position, rather than on its selected integer pixel position. This check box is located on the control panel that is accessible via the “More Settings” button. By default, this option is activated and the text associated with the centroid label on the main panel will be green to indicate this. Changed the photometry calculation so that it is now done with an aperture-position resolution of 0.02 pixels. Un-checking the check box will cause the photometry calculation to revert to the selected aperture position in integer pixel coordinates; nevertheless the photometry calculation will still be done with sub-pixel resolution.
Made further improvements to the documentation. Reduced the width of the “About & Help” window to 1100 pixels, so that it is displayable without horizontal scroll bars on some lower resolution computer screens.
v. 0.995 (1/5/09)
Added new source-list tool (launched via “Source List” button on upper-left side of main GUI panel), which reads in space-delimited source positions (one set of coordinates per line), in one-based integer image-pixel coordinates, and then allows the user to step through the source list, either automatically or manually, and perform and save aperture-photometry calculations. The maximum number of sources that will be read from a source list for processing by the tool is 10,000.
Added new decimal/sexigesimal toggle to user-preferences menu.
Renamed buttons “Choose Image” and “Show Header” to “Get Image” and “FITS Header”, in order to make more space on the main GUI panel for the new “Source List” button.
Improved calculation of the stretch limits automatically set when a new image is loaded.
Added computed image statistics to image-data histogram plot.
Made “live” the text fields associated with the lower/upper image-stretch bounds, so that when the enter key is pressed in these text fields, the new image stretch is performed.
Made “live” the text fields associated with the centroid, aperture, and sky-annulus radii, so that when the enter key is pressed in these text fields, the aperture photometry is recomputed. Also, added a focus listener to these fields, so that, when the user even mouse-clicks on one of these fields, the “Recompute Photometry”-button text will change from the color black to the color red to indicate that the photometry calculation may need to be updated.
Added and improved tool tips attached to various labels, buttons, and controls.
Made further improvements to the documentation.
v. 0.994 (10/30/08)
Modified preferences menu to move “Set photometry filename” and “Set scratch directory” to the top level.
Shortened label “magnification” to “magnify”. Shortened label “Stretch to Above Vals” to “Stretch to Bounds”.
Added relatively simple function to approximate (R.A., Dec.) from the real-time pixel coordinates and world-coordinate system keywords read from the FITS header, only for images that use the tangent projection (i.e., CTYPE1=”RA—TAN” and CTYPE2=”DEC–TAN” or CTYPE1=”RA—TAN-SIP” and CTYPE2=”DEC–TAN-SIP”); however, distortion corrections are not computed.
Added message dialogue to inform the user that a comparator image must be the same size as the primary image.
Changed the labels for the real-time image-pixel values from “Surface brightness (S. B.)” or “S. B.” to simply “Pixel value”, in an effort to make the software more general.
Added an option to the “More Settings” panel to allow the user to specify the default title for the image-pixel data in the plots; e.g., “Surface brightness”, “Flux”, “Counts” or whatever makes sense for a particular image. The default setting for this option is “Surface brightness”, which is appropriate for Spitzer IRAC images.
Modified the calculation of the background subtracted from the flux density to use actual number of aperture pixels instead of PI times aperture radius squared — this should be more accurate.
Made the following improvements to the zoom/pick tool: 1) added new capability to zap pixels (set their values to NaNs) temporarily; and 2) added new functionality to persist the picks and zaps when image-display controls are adjusted without changed the position of the aperture.
Added logic that changes the “Recompute Photometry” button text to the color red whenever 1) the spinner controls are activated to change the position of the aperture; or 2) the centroid, aperture, inner-sky or outer-sky radii are changed and the enter key is pressed. This is an indicator that the “Recompute Photometry” button needs to be pressed, in order to update the photometry calculation.
Bug fix #1: Corrected the “Source_unc” calculation to use the background-subtracted integrated source intensity, as opposed to the non-background-subtracted integrated source intensity, in the Poisson-variance term.
Bug fix #2: Made another correction to the “Source_unc” calculation: included a PI/2 expansion factor in the background-uncertainty term when the median is used to estimate the background.
Bug fix #3: Also corrected the “Source_unc” calculation to omit the background-uncertainty term when a custom sky is specified, and to omit both the background-variance term and the background-uncertainty term when no sky-background subtraction is specified.
v. 0.993 (9/26/08)
Sped up considerably the blink functionality for very large images by painting with separate threads the portion of the displayed image that is not seen in the scrolling-pane view port of the main image-viewing panel. Modified stretch and color-table controls to only operate on the visible portion of the image in the main image-viewing panel (plus some margin). Added new “Refresh 1” and “Refresh 2” buttons to refresh the image within and without the view port of the main image-viewing panel, respectively.
Modified the magnifier tool on the main panel to display the current blinked-to image that is displayed (be it the primary image or a comparator image), which is the behavior that the user expects (I think!).
Modified the real-time displayed values of cursor X-Y position and surface brightness (S. B.) so that they correspond to the current blinked-to image that is displayed (be it the primary image or a comparator image), which is, again, the behavior I think the user expects.
Added new “REAL-TIME RESULTS” label at the top of the sub-panel displaying the real-time values of cursor X-Y position and surface brightness (S. B.) on the main image-viewing panel.
Changed the “RESULTS” label to read “PRIMARY-IMAGE PHOTOMETRY RESULTS”, in order to make it clear that the photometry results are for the primary image. Moved this label to beneath the section that displays the real-time values of cursor X-Y position and surface brightness (S. B.).
Modified the software to compute the “Source_unc” associated with the “Source_intensity”. Added new “Source_unc” and “Sky_scale” columns to the photometry-table file (for definitions, see above section entitled “Columns in Photometry Table”). Included these quantities in the display of the “PRIMARY-IMAGE PHOTOMETRY RESULTS” sub-panel on the main image-viewing panel.
Removed one digit of precision from the photometry results displayed on the main image-viewing panel, in order to reduce the required display width.
Added new “Image” column to the photometry-table file, so that each table row is now unambiguously associated with the corresponding FITS file.
Changed the software’s behavior to show the current photometry-table file, as specified under the preferences menu, when the user clicks on the “Show Photometry File” button (previously, the software displayed the photometry-table file instantiated when the new primary image is loaded).
Changed the default radius for computing the source centroid to 10 pixels.
Added new “Snap” button that moves an existing aperture to the current source centroid location and then recomputes the photometric results. The “Snap” button text will turn the color yellow if the aperture and centroid locations do not coincide (to the nearest integer pixel).
Added logic that changes the “Recompute Photometry” button text to the color red whenever the “More Settings” panel is opened (and the settings therein are possible changed); this is an indicator that the “Recompute Photometry” button needs to be pressed, in order to update the photometry calculation.
Added new preferences-menu option to “clear” an existing photometry-table file, which means to remove the file and the re-create it with just a photometry-table header.
Experimental: For Spitzer IRAC images, now appending columns corresponding to MJD_OBS, DATE_OBS, FILTER settings to each photometry-table row.
Improved cursor-type control in function updatePhotometry (now, the DEFAULT cursor is displayed after the WAIT cursor when clicking on “Recompute Photometry” button, and the CROSSHAIR cursor is displayed after the WAIT cursor when clicking on the image to overlay an aperture).
Added tool tips to many of the buttons and controls.
Made further improvements to the documentation.
Bug fix #1 (this bug was born in v. 0.991): The labels displaying the image-data physical units on the “More Settings” panel, which are based on the BUNIT FITS-header value or assumed to be D.N. if BUNIT is not available, were previously not being updated after a new primary image is loaded, but now this is fixed.
v. 0.992 (8/8/08)
Added code to re-initialize fields in the “RESULTS” section (lower left portion of main panel) and “More Settings” panel to default settings when a new primary image is loaded.
Added new “Image Comparator” button with underlying functionality that pops up a separate panel with image magnifiers for the primary image and up to three comparator images (i.e., images for comparison).
Also added rudimentary image-blinking capability, which currently has several limitations that will be fixed in the near future: 1) not fast enough blinking for images larger than about 500×500 pixels; 2) independent stretch adjustments not available for each image in the blink sequence; 3) no automatic world-coordinate-system co-alignment of images; and 4) no capability to promote a comparator image to primary image and the main-panel analysis capabilities that go with it (workaround is to reload the images, new primary image first). Made further improvements to this document.
v. 0.991 (6/25/08)
Improved the graphs: 1) Added “Close” button; 2) Added date/time to upper-right corner of graph; 3) Removed symbols from all curves that are not directly associated with image data points; and 4) Replaced calls to deprecated JFreeChart functions with their newer counterparts (for cleaner compiling).
Changed the source code to dispose of closed windows, rather than just hiding them, for improved memory management.
Made further improvements to this document (i.e., paragraph on discipline).
Bug fix #1: Fixed array-indexing problem in image-binning function for computation of sparse image statistics.
Bug fix #2: Changed the behavior of the functionality associated with the “More Settings” button, so that no more than one “More Settings” panel is displayed at any given time.
v. 0.99 (6/13/08)
Added exit button.
Added optional “rainbow” color table, which is an alternative to the default “contour” color table and can be set via the preferences menu.
Changed default preferences filename from APT.prop to APT.pref.
Refactored some more source code to reduce memory requirements and greatly speed up the response of the scroll bars around the main image-viewing panel.
Increased the default maximum image size from 1000×1000 pixels to 5000×5000 pixels.
For compute-intensive operations — like changing the stretch or color table of very large images, plotting graphs or doing photometric calculations for very large apertures — modified the mouse-cursor icon to display a “busy” animation, in order to cue the user to wait for the operations to complete.
Modified file-chooser filter to accept FITS images with either “.fits” or “.fit” filename extensions.
Bug fix #1: Trapped nullPointerException that occurs when the “Image Histogram” button is hit before an image is loaded.
Bug fix #2: Fixed problem in setting up data array for sorting required by the computation of sparse image statistics, which had the adverse effect of giving a bad initial stretch for images having NaNs.
Bug fix #3: Added java option -mx300M, in order to allocate more heap space for very large images.
v. 0.98 (3/31/08)
Made changes to give the software more utility and make it more user-friendly: 1) Rearranged buttons, labels and text fields on the main panel to have a more compact layout; 2) Integrated the magnifier tool into the main panel; 3) Removed the hide feature on the zoom/pick tool; 4) Moved the color-table toggle and the display-stretch controls to the main panel from the four-level-deep submenu in the preferences menu; 5) Rearranged the preferences menu to go only two levels deep instead of four; and 6) Reduced the margin around the main image-viewing panel, in order to show more of the image in the available area.
Added preferences option for the user to select the pick color for the zoom/pick tool (under “Set Image-Display Attributes”).
Refactored some more source code to facilitate reusability and reduce memory requirements.
Added an image histogram plot to assist with setting the display stretch.
Added new sky model option to subtract the sky average (Model D).
Substituted for “image data units” the term “D.N.”, which stands for “Data Number”, in various GUI-panel labels. Added logic to use “D.N.” if the BUNIT keyword is missing or null in the image FITS header.
Put crosshairs on the magnifier tool for better aperture positioning.
Dramatically speeded up FITS-image loading.
Added preferences-menu option to specify the maximum image size that the software will load into memory.
Made further improvements to this document.
Bug fix #1: Added code to clear the computed photometry when the user clicks the mouse cursor off the image, and thereby preventing those results from being associated with an off-image position.
Bug fix #2: Fixed the action associated with the “Set Stretch to Image Min./Max.” button, so that the 0 and 100 percentiles of the difference between image minimum and maximum are used, instead of the (arbitrary) 20 and 80 percentiles.
Bug fix #3: Modified the code to default to the state of no image-data conversion to user-specified data units when a new image is loaded.
v. 0.97 (3/4/08)
Added a magnifier tool with three different zoom options (5x, 10x, and 20x).
Reformulated logarithmic display stretch to have more precise control of its dynamic range.
Refactored some source code to facilitate reusability.
Enabled simultaneous gray-scale or false-color displays in the main image-viewing panel, magnifier panel, and zoom/pick panel.
Changed preferences menu to conditionally enable dynamic-range menu option only when logarithmic display stretch is selected.
Bug fix #1: Switched from “FILES_AND_DIRECTORIES” to “FILES_ONLY” JFileChooser parameter, in order to prevent the selection of filenames that are actually directories when choosing a photometry-table filename.
Bug fix #2: Modified preferences menu to update displayed radio-button selections after loading previously saved preferences from a file.
Made further improvements to this document.
v. 0.96 (2/14/08)
Changed main-panel label “Pixel surface brightness” to “Surface brightness (S. B.)”.
Shortened the “More Photometry Settings” label on the associated button and dialog to “More Settings”.
Changed “background-subtracted” to “sky-subtracted” in graph y-axis titles in order to shorten them.
Added a “Show/Hide Zoom/Pick” toggle button and related functionality to cause the aperture zoom/pick tool to appear and disappear at will (hiding this tool makes the main image-viewing window larger).
Added two text panels to the zoom/pick tool, one for recording position and surface brightness data from prior picks, and the other for automatically displaying the positions of any NaNs present in the zoom/pick tool’s enlarged sub-image.
Enabled mouse cursor to change to cross-hair type over zoom/pick tool.
Added option to zoom/pick tool to allow its enlarged sub-image to be displayed in false colors (gray scale is the default); this option can be selected from the “Preferences” menu.
Changed the display of NaNs by the zoom/pick tool when in the false-color mode, to switch automatically from the blank color to dark gray.
Renamed the “Recompute Aperture” button to “Recompute Photometry”.
Modified the zoom/pick tool so that (X, Y, S.B.) values vary in real time as the mouse cursor moves over the enlarged sub-image.
Improved the documentation by adding screen shots of the software’s graphical user interface.
v. 0.95 (2/4/08)
Implemented the capability to handle images with a variety of BITPIX values (valid BITPIX = 8, 16, 32, -32, and -64; all images are read in and processed as 4-byte/pixel images).
Modified the FITS-image input functions to read in and conventionally apply BZERO and BSCALE FITS-keywords.
Documented how to remove an aperture overlaid onto the image (just click on the black frame around the image).
Changed the image display to show image blanks in the color blue by default (image blanks are pixels with NaN values, where NaN stands for “Not a Number”); before, the lack of special display handling of image blanks resulted in them being displayed as black in color.
Programmed the file chooser to open the directory from which the last image was selected.
Added a null-exception trap to set a maximum 800×800-pixel default sub-image region starting at pixel position (1, 1) when the cancel button of the associated input dialog is selected (this input dialog is displayed only when the input image’s NAXIS1 or NAXIS2 value exceeds 800 pixels).
Included consistency checking for the source and sky data-rejection thresholds, and an error dialog to display an alert if the user enters inappropriate values.
Added “Image_file” and “Date_time” keyword/values to the beginning of the contents of the FITS-header file (fitsHdr.txt), in order to unambiguously identify the corresponding FITS image and when the FITS-header file was created.
Developed new capability to display an image with a logarithmic stretch.
Implemented functionality for listing, setting, loading, and saving preferences.
Added capabilities for including the following as user-selectable preferences: 1) Output directory/filename for saving the photometry-table file (e.g., APT.tbl); 2) Scratch directory for saving temporary files; 3) Color used to display image blanks (NaN pixels); 4) Toggle between linear and logarithmic stretch for the image display; and 5) Dynamic range of logarithmic stretch.
Fixed the code so that the numerical results from the previous calculation are not misleadingly displayed for a new aperture that contains only image blanks.
Changed main-panel label “Pixel flux density” to “Pixel surface brightness”.
Changed the default title on the intensity axis of the graphs from “Flux density” to “Surface brightness”. Added new “Image data-title after conversion” text field to the “More Photometry Settings” dialog; this allows users to not only specify the image-data units and conversion factor, but also the title on the intensity axis of the graphs.
Added internal checking to the source code to force the user to click on the “Recompute Aperture” button after making changes in the “More Photometry Settings” dialog, in order to prevent showing graphs that are possibly inconsistent with the new photometry settings (sky model, outlier-rejection limits, image-data conversion to other data units, etc.).
Fixed the problem of the old aperture remaining visible when a new image is displayed.
Modified the display to show “N/A” (not available) instead of “NaN” (Not a Number) when the mouse cursor is not on the image or the aperture photometry calculation has not yet been done (“NaN” is still shown for the pixel surface brightness when the mouse cursor is placed on a pixel containing an actual NaN).
Added the capability of searching the FIT-header listing.
Added new “Curve of Growth” graph.
Modified the plot routines to automatically write the plotted data to output files in the scratch directory: apertureSliceX.dat, apertureSliceY.dat, radialProfile.dat, sourceScatter.dat, skyScatter.dat, and curveOfGrowth.dat.
Changed label “Aperture flux” on main panel to “Source_intensity”, and changed column-heading “Source_flux” to “Source_intensity” in the output photometry table.
Added an aperture zoom/pick tool.
Added a “Hide/Show Aperture” button and underlying functionality.
v. 0.94 (1/10/08)
Fixed a bug that was causing non-square images to be incorrectly read, and added logic to enforce a maximum sub-image size of 800×800 pixels, in order to keep the image read time to under 12 seconds (this constraint will be relaxed later, after an ultra-fast read function has been integrated into the source code).
Widened the “Busy Loading Image…” dialog-box frame (needed by Windows).
v. 0.93 (12/5/07)
Changed the button label “Recompute Last Aperture” to simply “Recompute Aperture”, in order to avoid misunderstandings as the aperture position and size may have changed since it was last computed.
Appended to the aperture position label spinner fields/controls for incrementing or decrementing by one pixel the aperture position for fine tuning (changes by a fraction of pixel will be allowed later, after the flux calculation has been modified for sub-pixel interpolation).
Added new “N_aper”, “N_rej”, and “N_sky” columns to the output photometry-table file, renamed some existing columns in the table for clarity and better organization, and moved the columns for source centroid coordinates next to the columns for aperture coordinates.
Created a table of photometry-table-column definitions in this file.
Did some source-code restructuring to eliminate redundant code.
Added an option for subtraction of a user-customized sky value.
Changed the centroid calculation to work on sky-background-subracted data, for greater sensitivity.
Changed the UneditableTextViewer class to not display multiple windows of the same file content, and also made it so the “About & Help”, “FITS header” and “Show Photometry File” windows can be viewed simultaneously.
Bug fix: until now, the sky-background uncertainty and sky average were not being multiplied by the optional flux-conversion factor as they should.
v. 0.92 (11/12/07)
Fixed another bug in Aperture Slice plot, which was introduced in the previous version (the first data point for each slice at the negative outer-sky boundary was not being plotted).
Added a check to assure that the aperture contains at least one sample before being allowed to display the plots.
Modified the software to display a “waiting” mouse cursor when loading an image, in order to convey simply that work is in progress; also added a pop-up frame with the message “Busy loading image…” during this process (which automatically goes away after the image is loaded).
Limited the size of the displayed input image to 700×700 pixels, and modified the software to allow reading, storing, and displaying a sub-image up to this size from an input image of arbitrary size.
Modified the slider controls to reset to their default minimum/maximum positions after either of the two “Set Stretch…” buttons are pressed.
Added capability of saving output data to a “photometry file” in the working directory, called APT.tbl, where the data are always appended to the file. Switched from a proportional-spaced font (仿宋) to a monospaced font (Courier) for displaying the FITS header and the photometry file. No longer show calculated values of sky average and R.M.S. sky on the display, but still include these values in the records written to the photometry file. Reverted to computing the sky-background sigma using the conventional standard-deviation calculation (instead of using the median as an estimate of the average, which is an unconventional method of calculation that is conservative and could be called the “dispersion about the median”).
v. 0.91 (11/5/07)
Fixed bug in Aperture Slice plot (got rid of extra unwanted [0, 0] data points in slice curves that arise if aperture extends off image).
Added image scroll bars.
Made modifications to make the software more memory efficient.
v. 0.9 (11/2/07)
Initial release of beta-test version.
Acknowledments
Aperture Photometry Tool’s motto Inviso notitia and logo are copyright © by California Institute of Technology.
JFreeChart software is harnessed for graph generation and display (www.jfree.org). Also, use in this software is made of the JRegEx package (jregex.sourceforge.net) and the Jama package (math.nist.gov/javanumerics/jama).
Thanks to the beta-testers. In particular, Drs. John Fowler, Seppo Laine, Robert Lupton, Frank Masci, Alberto Crespo-Noriega, Bill Reach, Luisa Rebull, Nancy Silbermann, and Jeonghee Rho made numerous helpful suggestions.
Thanks to Drs. Tom Jarrett and Frank Masci for providing the formula for source-intensity uncertainty.
Thanks to Xiuqin Wu, Trey Roby, Loi Ly, and Booth Hartley for generous expert Java-programming help and the use of their Spitzer SPOT/Leopard Java classes.
A special thanks to Dr. Varoujan Gorgian for suggesting the need for this tool (and thus giving me something to do in my copious spare time!).
License
You are granted permission to use Aperture Photometry Tool only for purposes of research and education in astronomy and astrophysics. Use of this software outside of these scientific fields is prohibited without express permission from the creator of Aperture Photometry Tool.
Limitation of Liability
In no event and under no legal theory, whether in tort (including negligence), contract, or otherwise, unless required by applicable law (such as deliberate and grossly negligent acts) or agreed to in writing, shall the creator of Aperture Photometry Tool or California Institute of Technology be liable to users of the software for damages, including any direct, indirect, special, incidental, or consequential damages of any character arising as a result of this License or out of the use or inability to use the software (including but not limited to damages for loss of goodwill, work stoppage, computer failure or malfunction, or any and all other commercial damages or losses), even if the creator of Aperture Photometry Tool has been advised of the possibility of such damages.
Disclaimer
Aperture Photometry Tool (APT) is distributed WITHOUT ANY WARRANTY; WITHOUT ANY IMPLIED WARRANTY OF MERCHANTABILITY or FITNESS FOR A PARTICULAR PURPOSE.
|